


Key Takeaways
- Bitcoin’s price took a wild $3,215 ride, only to wind up near $77,300 with a tiny 0.2% gain.
- BTC’s bigger trend still looks healthy, but the short-term charts are all over the place below $78,800.
- Bitcoin bulls have work to do: crack $78,800, and that $82,280-$82,830 neighborhood is back in the cards.
1-Hour Bitcoin Price Chart
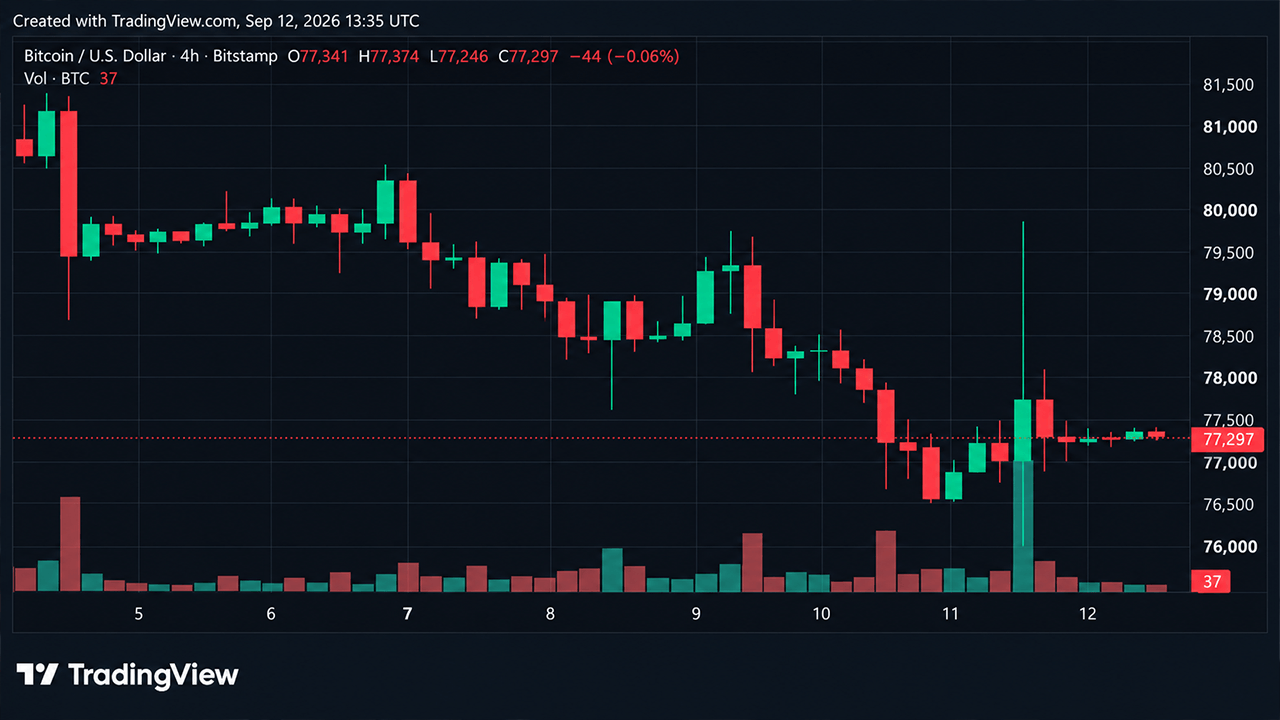
Bitcoin’s price on the 1-hour chart looks like a market that went through all that trouble just to end up back where it started. After sliding through a descending channel from an annotated $81,401 high around Sept. 5, bitcoin dropped as low as $76,040 around Sept. 11, suddenly came alive, and then got turned away after pushing into the upper $79,000s.
Since then, the fireworks have mostly disappeared. Price has settled into a cramped Saturday range around $77,000-$77,500, and those small candles suggest buyers and sellers are both waiting for somebody else to make the first move. It’s similar to a log poker game where no one is truly playing or showing their cards. For now, $76,040-$76,400 is the floor to watch if things get messy again.
4-Hour Bitcoin Price Chart
The 4-hour chart is where the recent loss of momentum becomes much harder to miss. Bitcoin’s price came roaring out of an annotated $62,470 mid-August low and traveled all the way to $82,281 around Sept. 4, but eventually that run ran out of gas. What followed was a string of lower highs and a much choppier market stretching from the low $80,000s toward the mid-$70,000s.
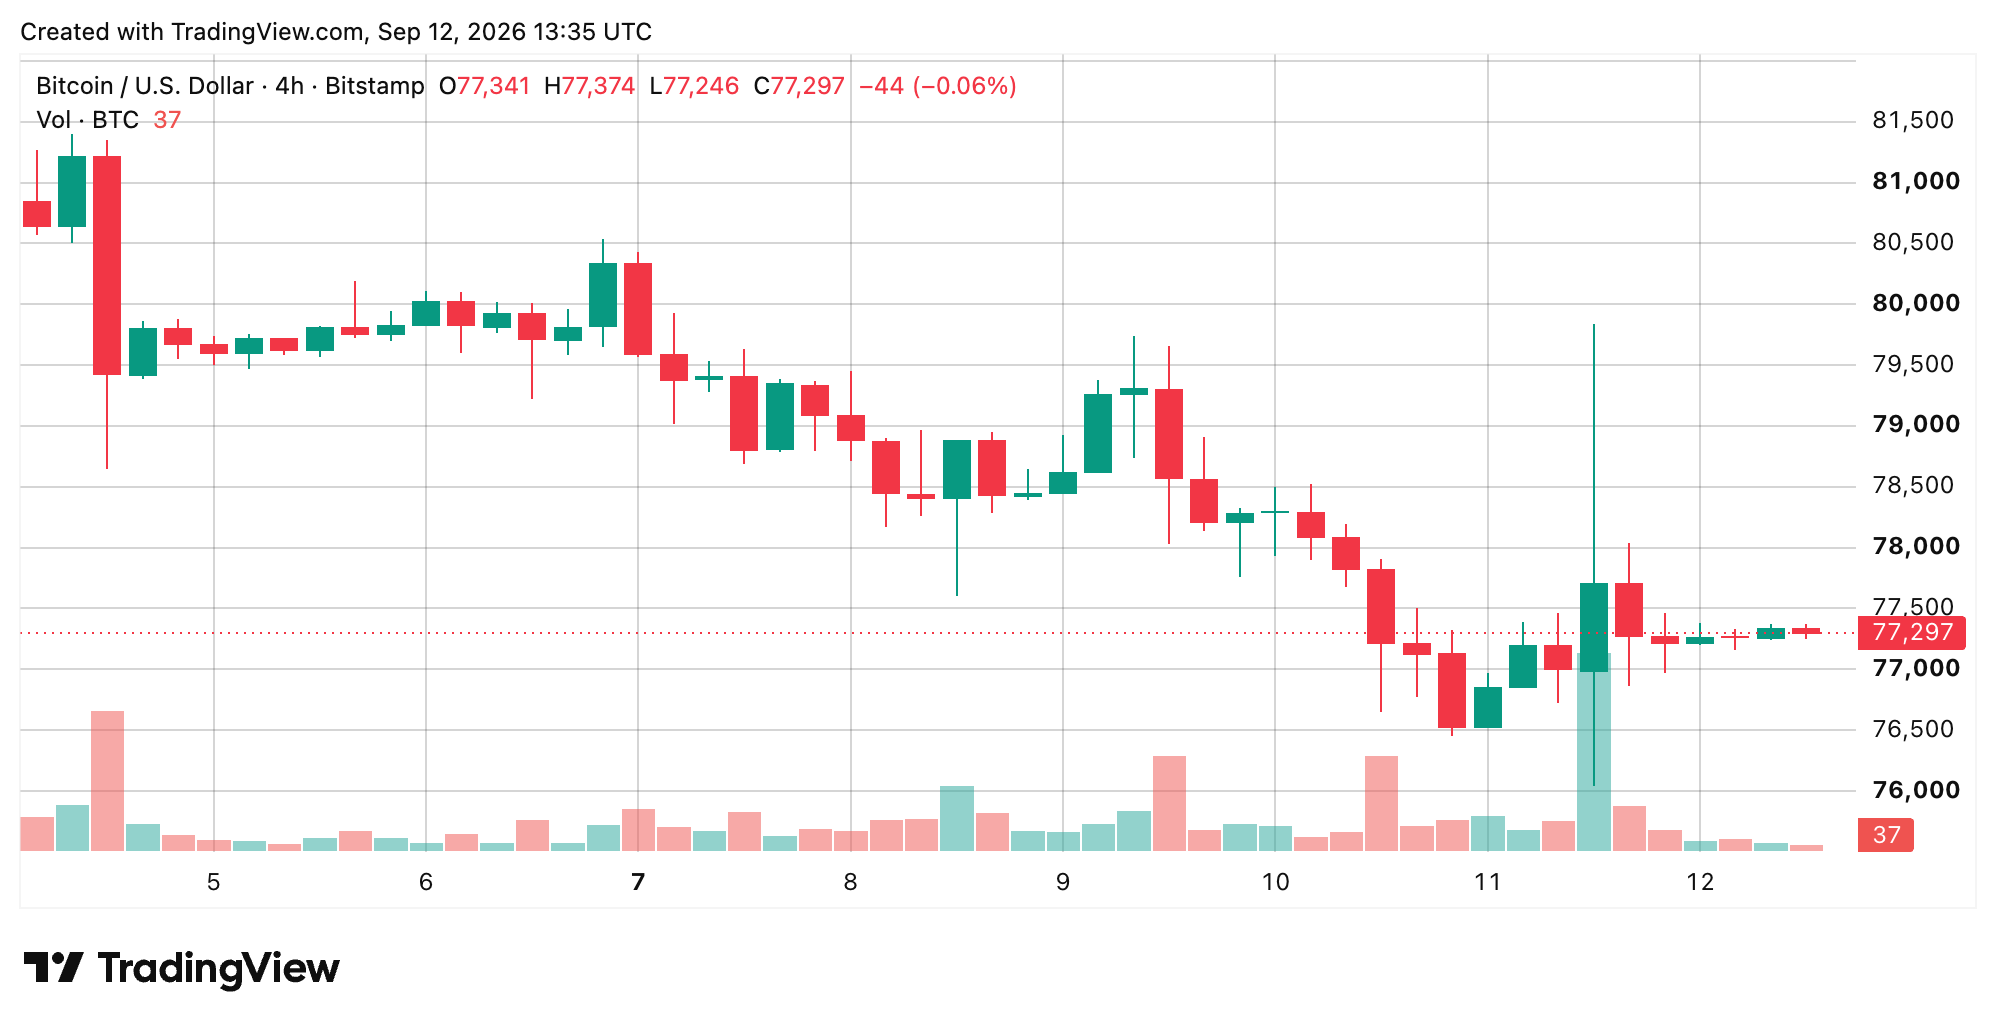
Bitcoin most recently got knocked into the mid-$76,000s before fighting its way back toward $77,300, and volume actually picked up during the Sept. 11 bounce compared with the quieter trading beforehand. That gives bulls something to work with, but they still have some heavy lifting ahead. Getting through roughly $77,970-$78,800 would put bitcoin back above several short daily averages currently leaning bearish.

24-Hour Bitcoin Price Chart
The daily chart, funnily enough, looks considerably healthier than all that short-term commotion would have you believe. Bitcoin’s price journey begins at an annotated $57,735 swing low, works through a months-long recovery, and eventually reaches an annotated $82,833 high after the late-summer push into the low $80,000s.
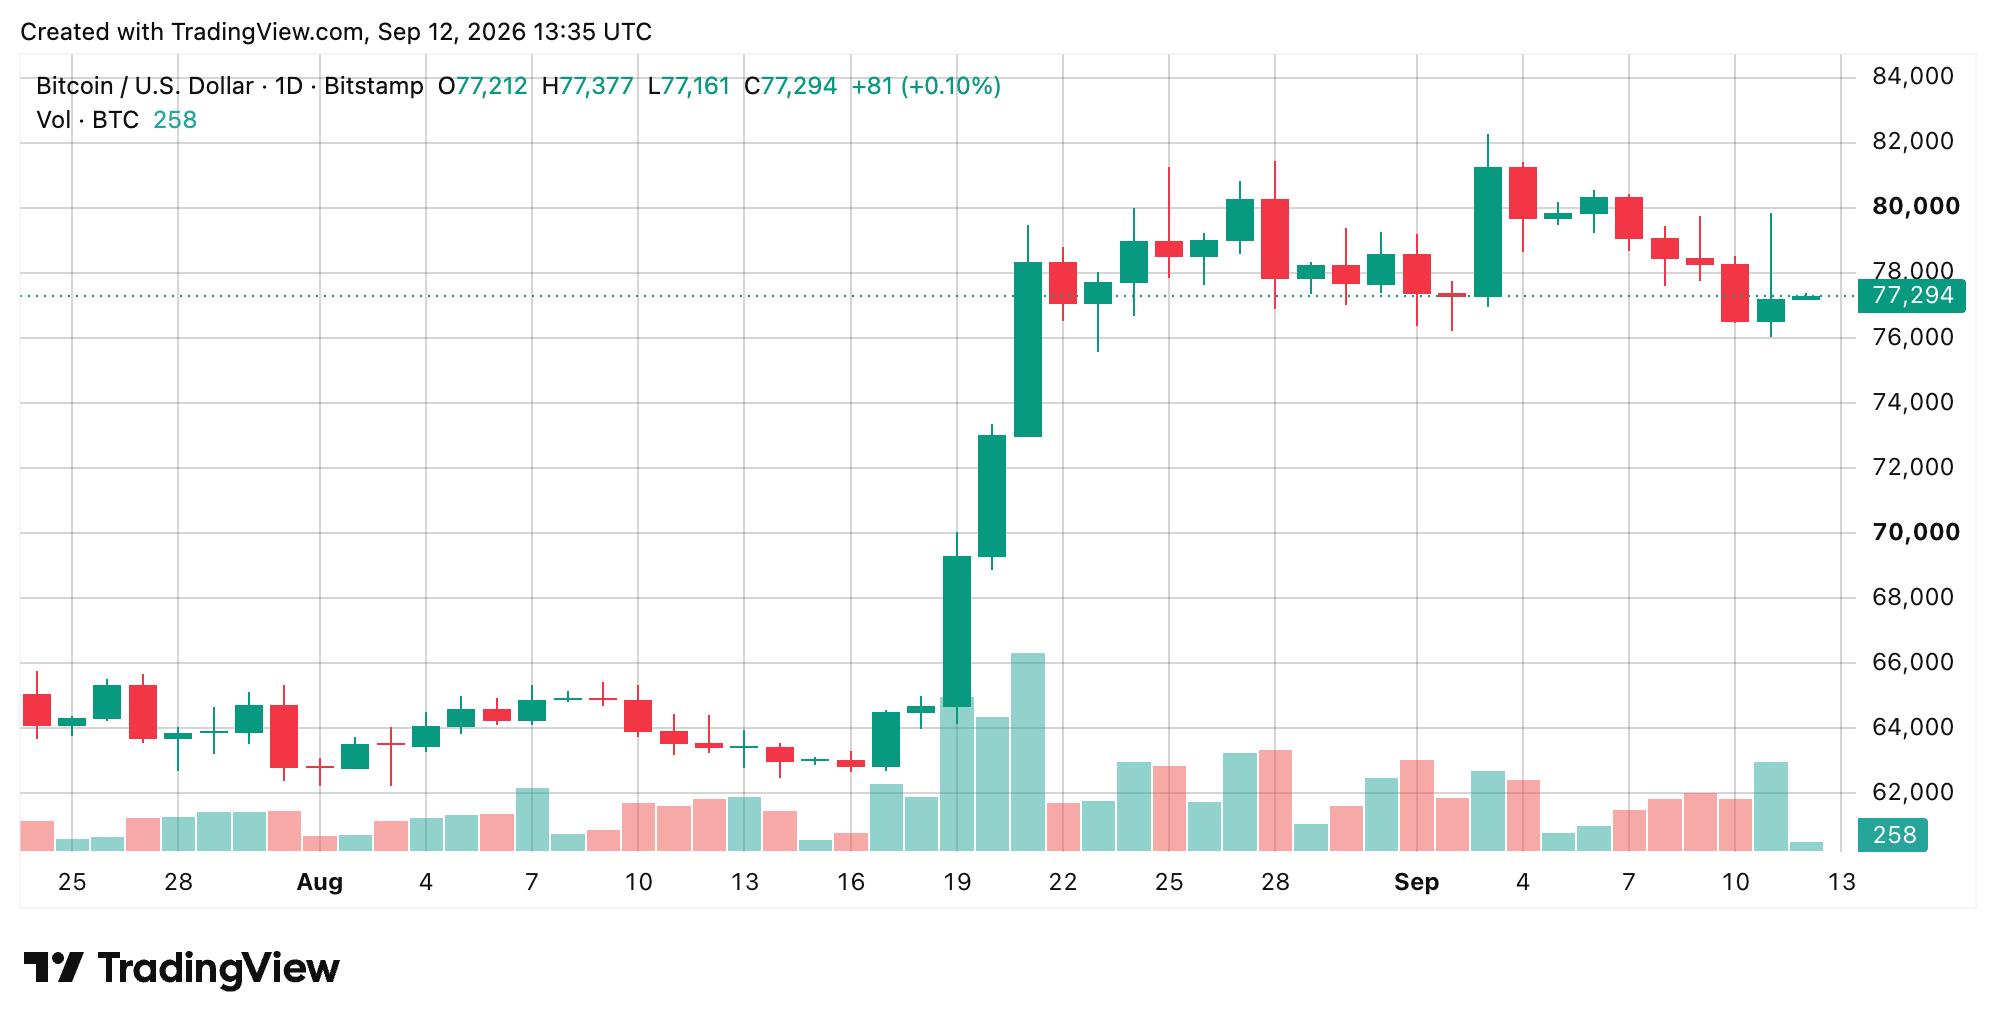
Since then, bitcoin has backed off, but it has not exactly fallen off the rails either, with the mid-$70,000s holding while price consolidates beneath the August and early-September highs. There is another interesting wrinkle hiding in the chart: volume was heavier during the recovery than it has been during the subsequent drift lower. If buyers can eventually crack $82,280-$82,830, those visible 4-hour and daily swing highs disappear from the road, and bulls could find themselves back in the driver’s seat.
Oscillator Noise
The daily chart’s oscillators are where things get a little funny because, for all the noise around bitcoin lately, most of them are basically sitting on the fence. The relative strength index is 55 and neutral today, while Stochastic sits at 15 and neutral as well. The commodity channel index at -112, average directional index (ADX) at 44, Awesome oscillator (AO) at 4,034, Stochastic RSI Fast at 8, Williams percent range at -80, and the ultimate oscillator (UO) at 40 are all neutral too.
In other words, there is a great deal of data here without much agreement on where bitcoin wants to go next. Momentum at 11 and bull bear power (BBP) at -1,171 lean positive and bullish, while the moving average convergence divergence level (MACD) at 1,814 takes the other side with a negative, bearish reading. Add everything together shows one bearish, eight neutral, and two bullish oscillator signals. For anyone hoping the oscillators would settle the argument, no such luck. Right now, the next move really is anyone’s guess.
Bitcoin’s Moving Averages
The moving averages (MAs) tell a more optimistic story, although there is a bit of fine print worth reading before breaking out the champagne. The 10-period exponential moving average (EMA) at $77,971 and the 10-period simple moving average (SMA) at $78,797 are both negative, while the 20-period SMA at $78,592 and the 20-period volume weighted moving average (VWMA) at $78,611 lean bearish as well. That is basically the short-term market waving a yellow flag.
On the flip side, the 20-period EMA at $77,031 is positive, and every listed 30-, 50-, 100-, and 200-period EMA and SMA is bullish as well. The Ichimoku baseline at $73,131 sits neutral, while the 9-period hull moving average (HMA) at $76,505 leans bullish. All told, the moving averages deliver ten bullish, four bearish, and one neutral signals. Put simply, bitcoin’s bigger trend is still standing while the short-term machinery works through a rough patch. Bulls are not out of the woods yet, and getting back through roughly $78,000-$78,800 looks like the hurdle that could finally move the needle.
Bull Verdict
The bulls still have a decent hand to play here. Bitcoin has absorbed a pretty hefty pullback without wrecking the bigger trend; the mid-$70,000s are still holding, and most of the longer-term moving averages remain firmly positive. If buyers can muscle through $78,800 and keep going, $82,280-$82,830 comes back into view pretty quickly. Clear that neighborhood, and the bulls could be right back in the driver’s seat.
Bear Verdict
The bears have plenty to work with in the meantime. Bitcoin has already been rejected from the upper $79,000s, short-term momentum has lost steam, and several of the averages sitting overhead are still leaning negative. If $76,040-$76,400 finally gives way, that comfortable-looking floor suddenly disappears. Until bitcoin gets back above $78,800, bears can make a pretty convincing case that this market is still not the bull’s domain.