


The Bitcoin price is stuck in place. BTC is trading flat over the past 24 hours and down about 6% over the past week. On the surface, nothing dramatic is happening. Underneath, however, four separate risk signals are starting to align. A bearish chart pattern is forming. Long-term holders are selling faster. ETF demand has just logged its weakest week since November. And the buyers replacing sellers are increasingly short-term and speculative.
None of these signals alone would break the market. Together, they suggest Bitcoin is losing conviction at a sensitive level.
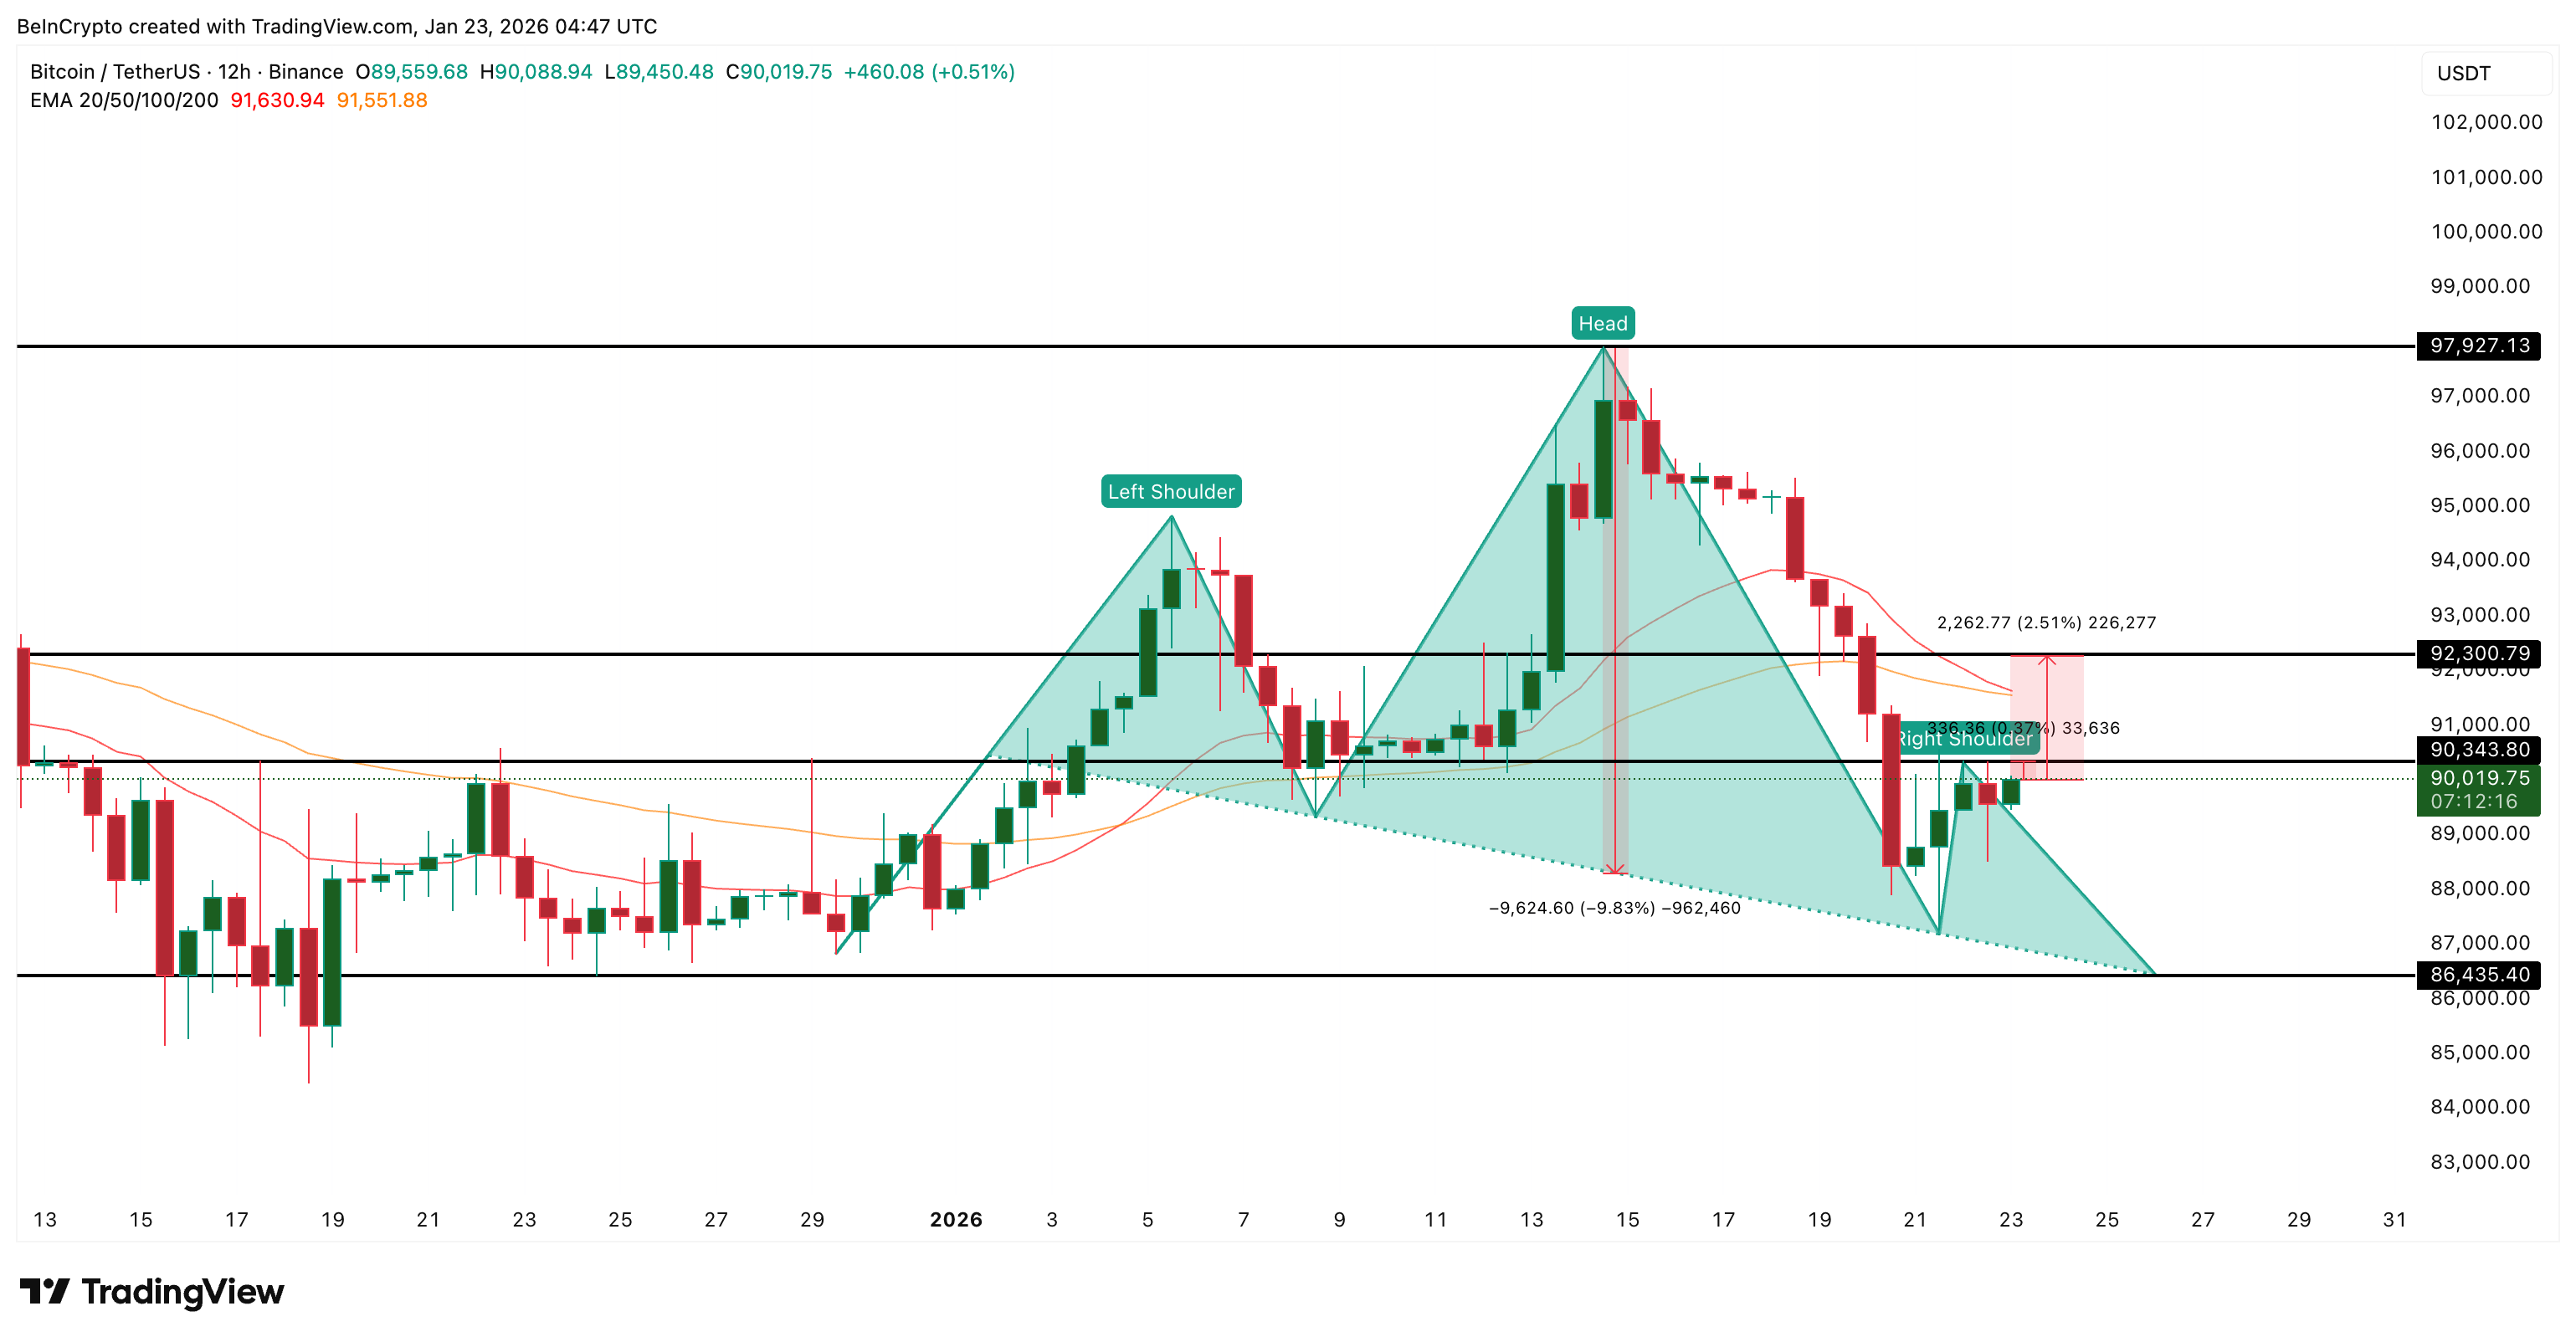
A Bearish Chart Pattern Forms as Momentum Weakens
On the 12-hour chart, Bitcoin is forming a head-and-shoulders pattern. This pattern reflects a loss of upward momentum, where each rally attempt tops out lower than the last. The neckline sits near $86,430.
Sponsored

Sponsored
If price breaks that neckline, the measured move implies a downside of roughly 9–10%.
Want more token insights like this? Sign up for Editor Harsh Notariya’s Daily Crypto Newsletter here.
Momentum supports that risk. The 20-period exponential moving average is rolling over and closing in on the 50-period EMA. An EMA gives more weight to recent prices and helps track trend direction. A bearish crossover would make it easier for sellers to push the price lower.
This weakening structure becomes more concerning once holder behavior is added.
Long-Term Holders Accelerate Selling as Conviction Softens
Long-term holders, wallets holding Bitcoin for more than a year, are increasing selling pressure.
Sponsored
Sponsored
On January 21, long-term holders sold roughly 75,950 BTC (outflows). By January 22, that figure jumped to about 122,486 BTC. That is an increase of roughly 61% in one day, a sharp acceleration rather than a steady distribution.
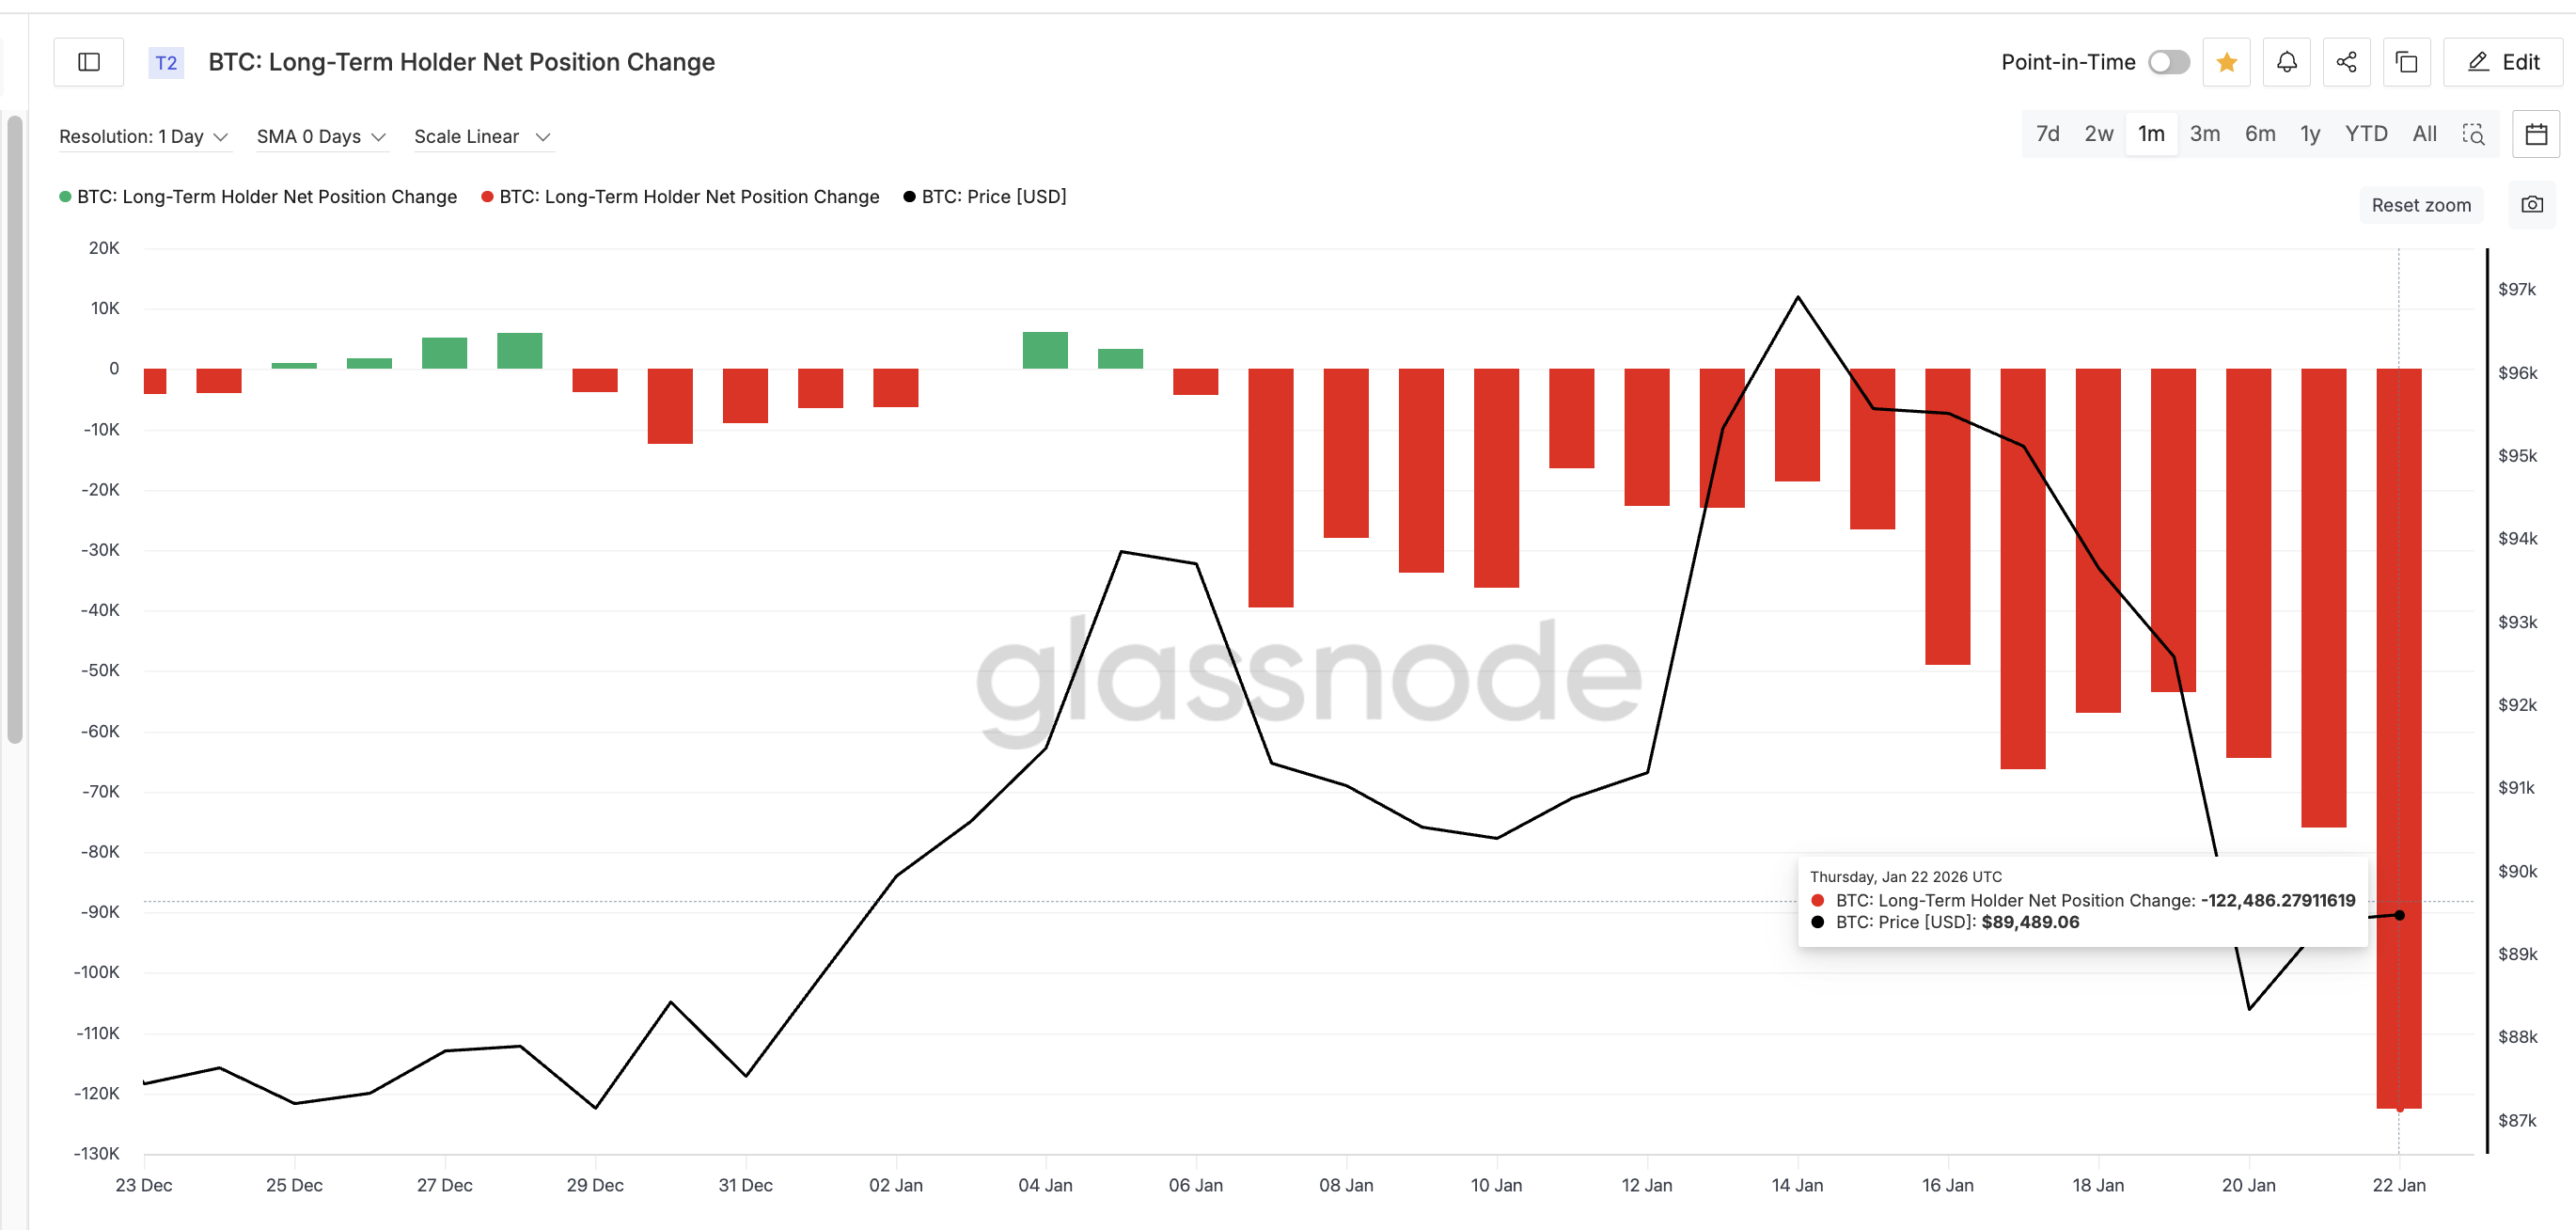
This selling is not happening from fear but from a lack of higher price conviction. Long-term holder NUPL, which measures unrealized profit or loss, has dropped to a six-month low but remains in the belief zone. Holders are still sitting on profits.
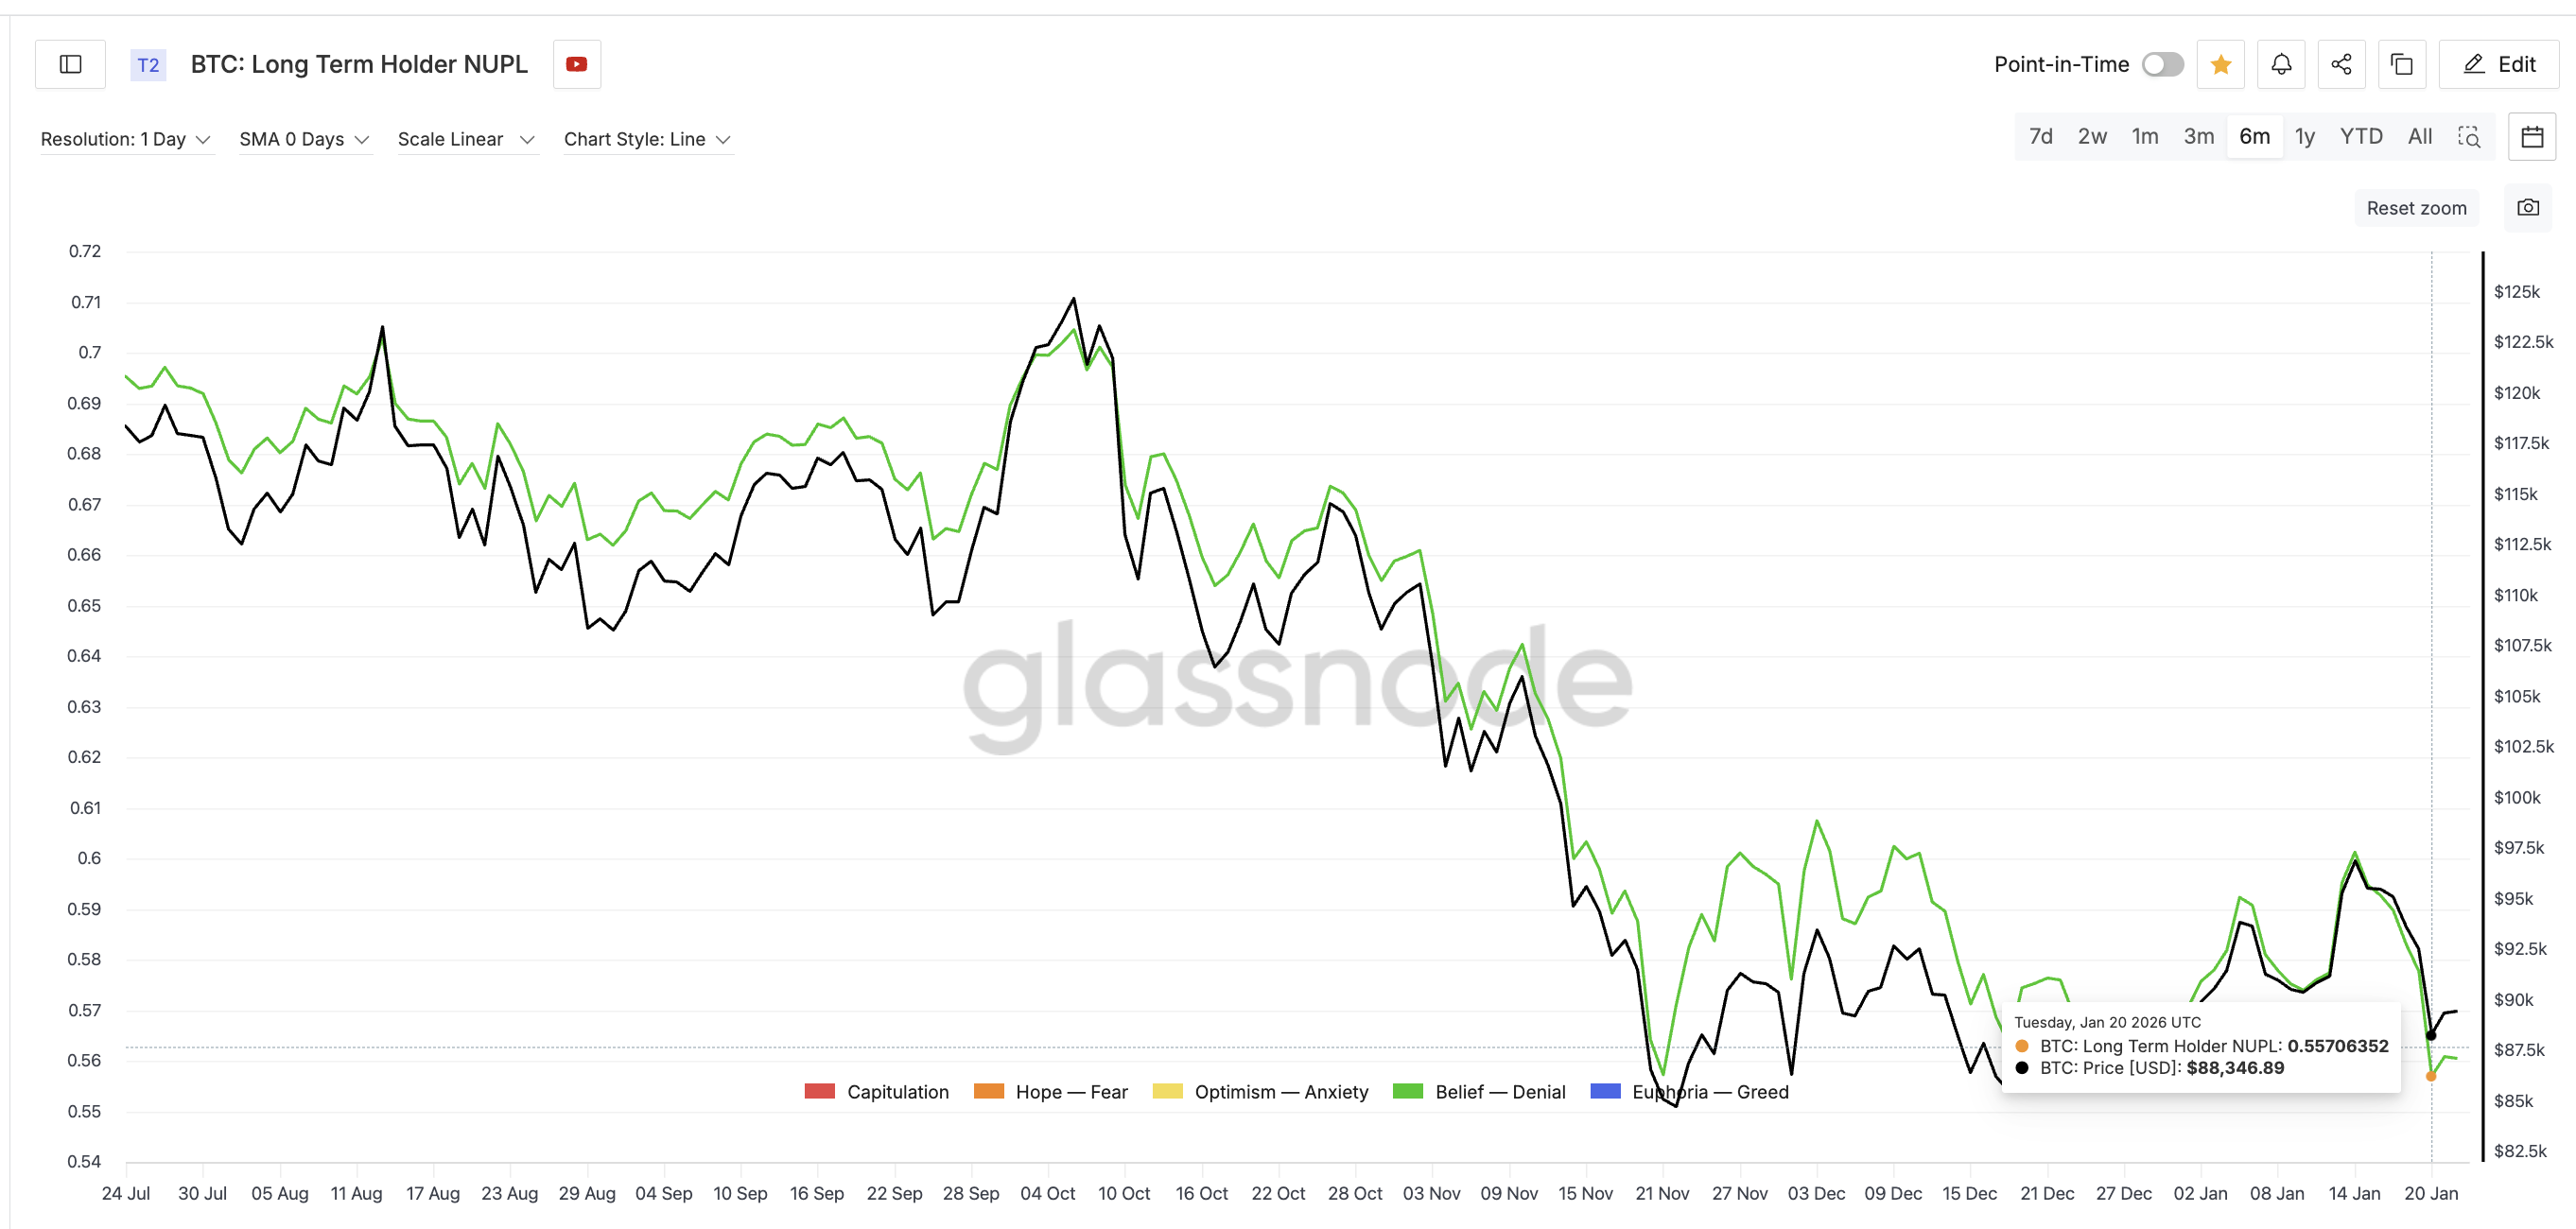
That means selling is voluntary. They are choosing to reduce exposure, not being forced out. As these high-conviction holders sell, the type of buyers stepping in matters. The long-term supply release is also highlighted by experts on X:
Sponsored
Sponsored
Bitcoin ETF Demand Weakens as Speculative Buyers Move In
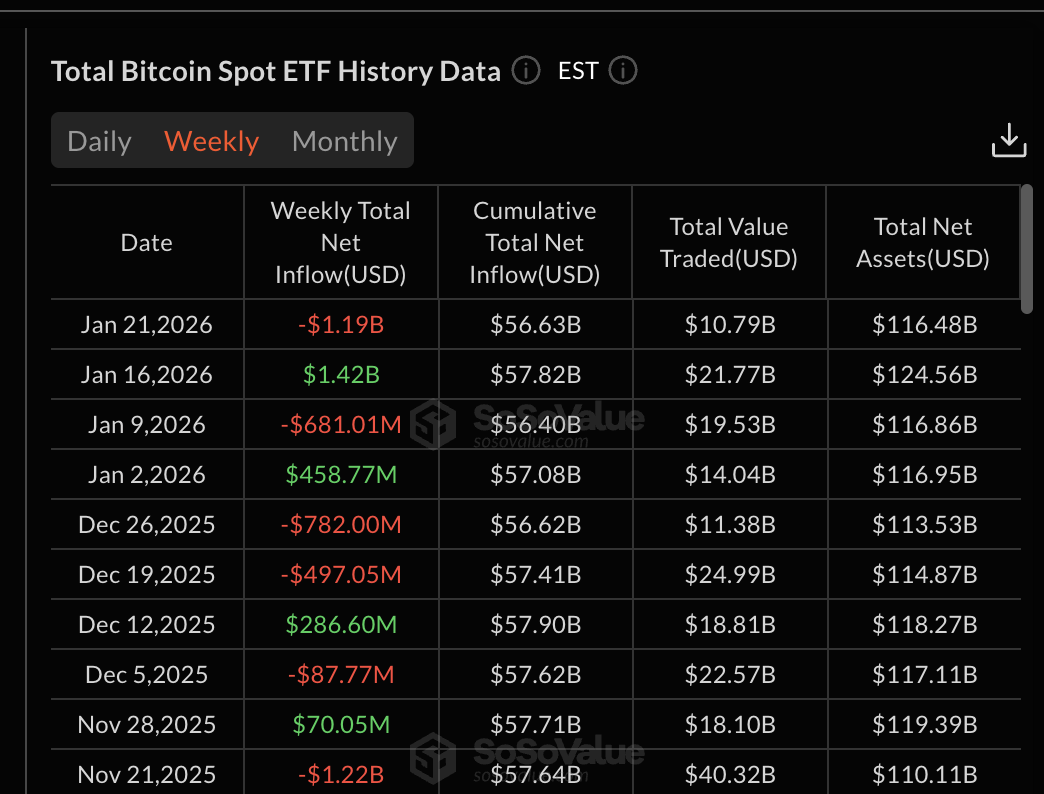
Bitcoin spot ETFs just recorded their weakest week of 2026 and the weakest weekly demand since November.
For the week ending January 21, ETFs saw net selling of about $1.19 billion. That removed a key source of steady demand that had previously absorbed holder selling during pullbacks. Therefore, like holders, even ETF players aren’t banking on the BTC price conviction for now.
At the same time, HODL Waves (a time-based holding metric) data shows speculative participation rising. The one-week to one-month holder cohort increased its supply share from roughly 4.6% on January 11 to about 5.6% now. That is a gain of nearly 22% in cohort share over a short period.
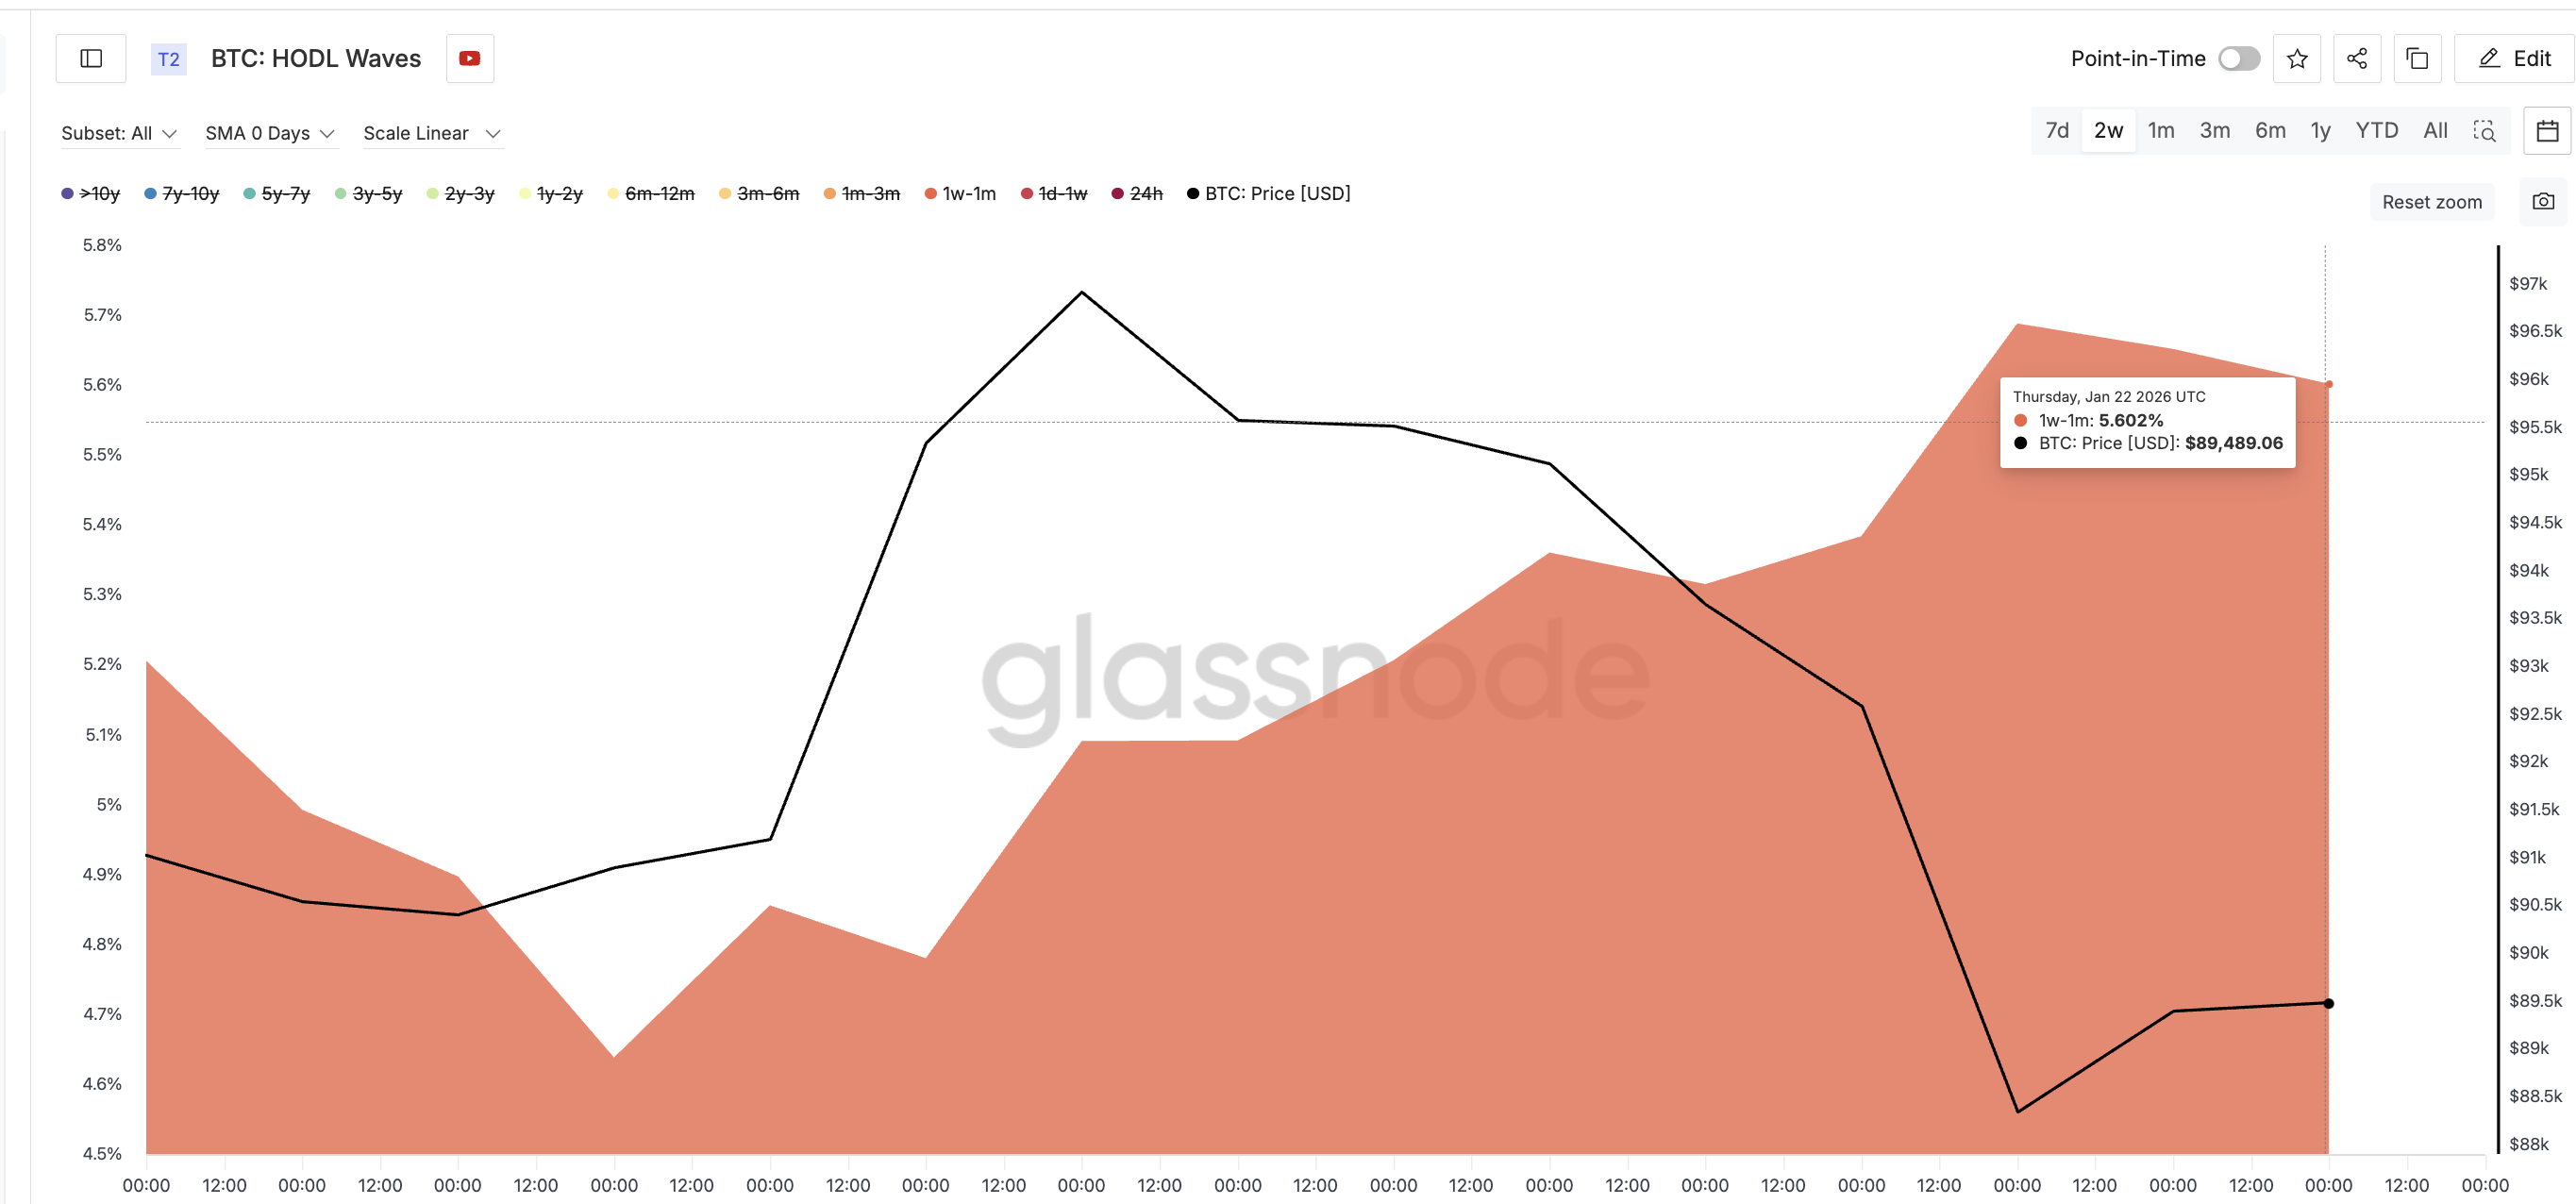
This matters because these holders typically buy dips and sell rebounds. They do not provide durable support.
Sponsored
Sponsored
So Bitcoin is seeing a handoff from long-term holders and ETFs to short-term traders. That transition often caps upside and increases downside sensitivity.
Key Bitcoin Price Levels That Decide Whether Risk Escalates
All four risks (technical, long-term selling, ETF weaknesses, and speculative inflow) now funnel into a narrow price range.
On the upside, Bitcoin needs a strong 12-hour close above $90,340 to ease immediate pressure (above the right shoulder). A reclaim of $92,300 would be more meaningful, as it would push the price back above key moving averages.
Until then, the bearish setup remains active.
On the downside, a loss of $86,430 would confirm the head-and-shoulders breakdown. With long-term holders selling faster, ETF demand at a multi-month low, and speculative buyers dominating, downside moves could accelerate quickly once support fails.