


Key points:
- Bitcoin continues to face resistance near $79,500, but the trajectory remains up as long as the price holds above $76,000.
- Most major altcoins are not showing any directional bias, suggesting a near-term consolidation.
Bitcoin (BTC) attempted to rise above $79,500, but the bears held their ground. BTC investor and author Michael Terpin told Cointelegraph that BTC risks falling to $57,000 in October 2026, based on a study of the “historical average” drawdown of about one year from a market-cycle top. Terpin added that BTC will have to rise above $100,000 for the bull market to resume.
Another negative view came from Bitcoin analyst Matthew Hyland, who said in a post on X that the “larger expected consensus outcome for BTC is another leg lower by October.” Veteran trader Peter Brandt also opined in an X post that BTC may form “an investable low” in September or October.

Crypto market data daily view. Source: TradingView
While several analysts expect a fall in BTC, crypto sentiment platform Santiment has a different view. Santiment said in a post on X that BTC wallets holding between 10 and 10,000 BTC have added 40,967 BTC since April 10, while retail investors holding less than 0.1 BTC have accumulated 46 BTC during the same period. If whales continue to buy and retail investors book profits, that may signal a long-term bull run.
Could BTC and the major altcoins rebound off the support? Let’s analyze the charts of the top 10 cryptocurrencies to find out.
S&P 500 Index price prediction
The S&P 500 Index (SPX) rose to a new all-time high on Friday, indicating that the bulls are in command.
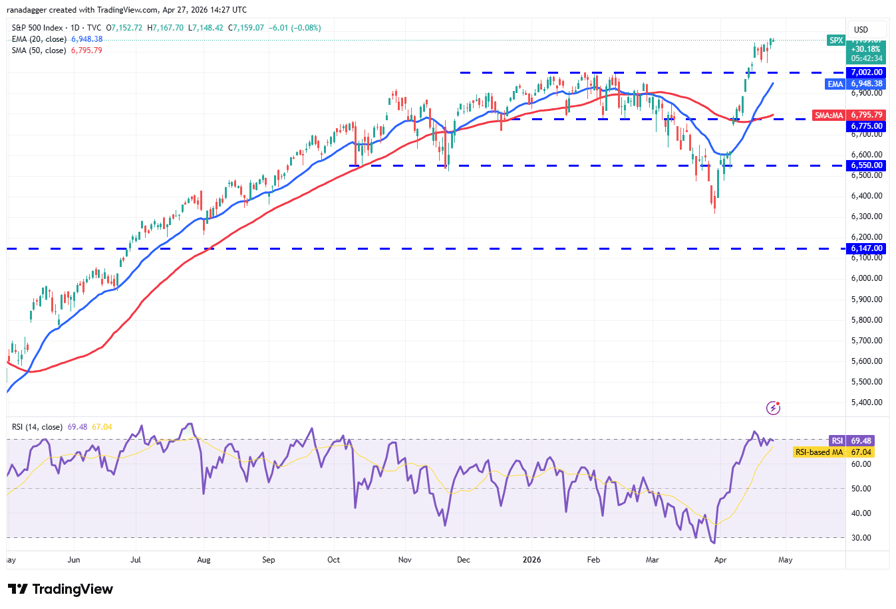
SPX daily chart. Source: Cointelegraph/TradingView
The upsloping 20-day exponential moving average (6,948) and the relative strength index (RSI) near the overbought zone suggest the up move may continue. The next levels to watch on the upside are 7,500 and then 7,877.
Sellers will have to swiftly yank the price back below the 20-day EMA to weaken the bullish momentum. If they manage to do that, the index may tumble to the 50-day simple moving average (6,795).
US Dollar Index price prediction
The US Dollar Index (DXY) reached the moving averages, where the bears are posing a stiff challenge.
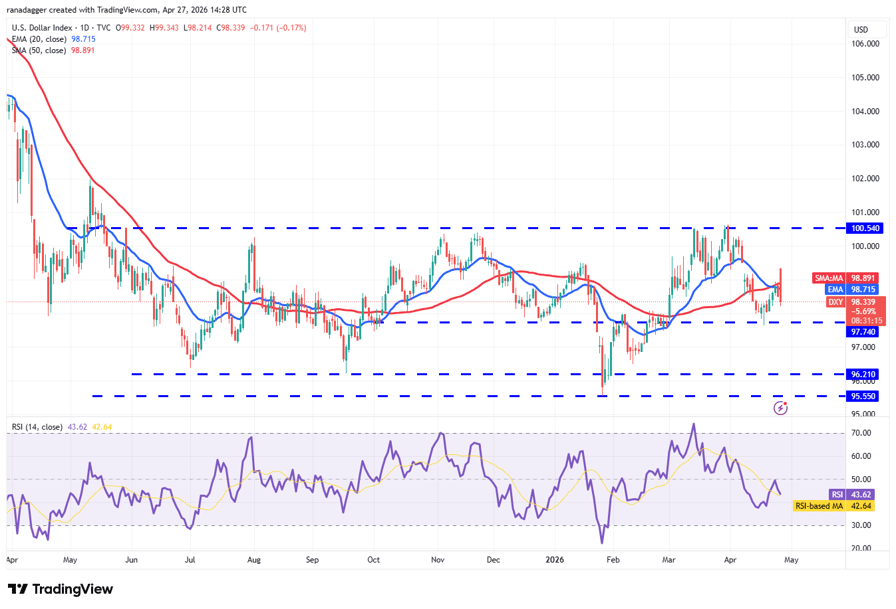
DXY daily chart. Source: Cointelegraph/TradingView
The bears will attempt to push the price toward the 97.74 level, where buyers are expected to step in. However, if the bears push the price below the 97.74 level, the index may sink toward the 96.21-95.55 support zone.
On the upside, the bulls will need to sustain prices above the moving averages to increase the likelihood of a rally toward the 100.54 level. The bears will attempt to keep the index inside the 95.55 to 100.54 range by selling near the overhead resistance.
Bitcoin price prediction
BTC has been sustaining above the breakout level of $76,000, indicating that the bulls are not hurrying to book profits.
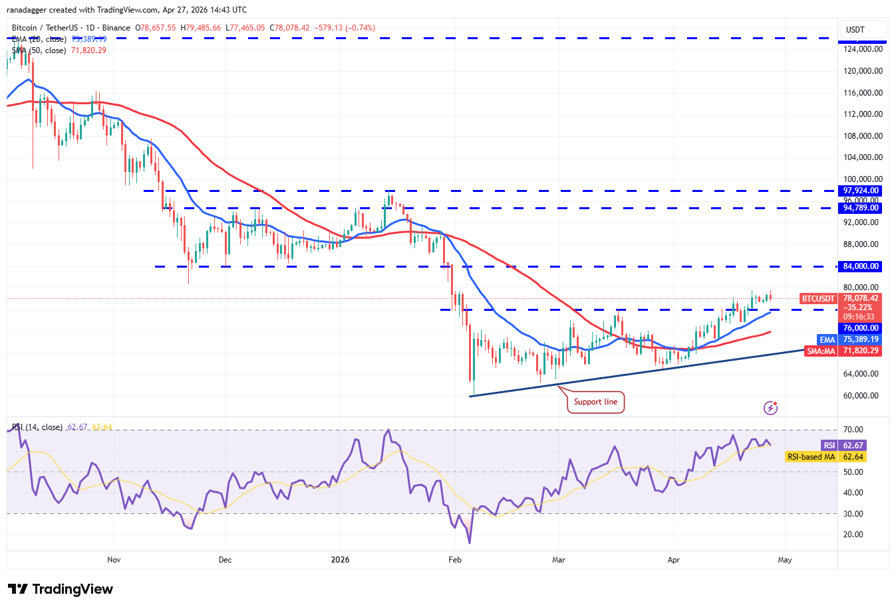
BTC/USDT daily chart. Source: Cointelegraph/TradingView
The upsloping moving averages and the RSI in the positive zone signal that the path of least resistance is upward. If buyers thrust the price above $80,000, the BTC/USDT pair may skyrocket to $84,000.
Time is running out for the bears. They will have to quickly pull the BTC price below the 20-day EMA to gain the upper hand. The pair may then decline to the 50-day SMA ($71,820), signaling that the bears are active at higher levels.
Ether price prediction
Ether (ETH) remains above the 20-day EMA ($2,295), but bulls have failed to push it above the $2,465 resistance.
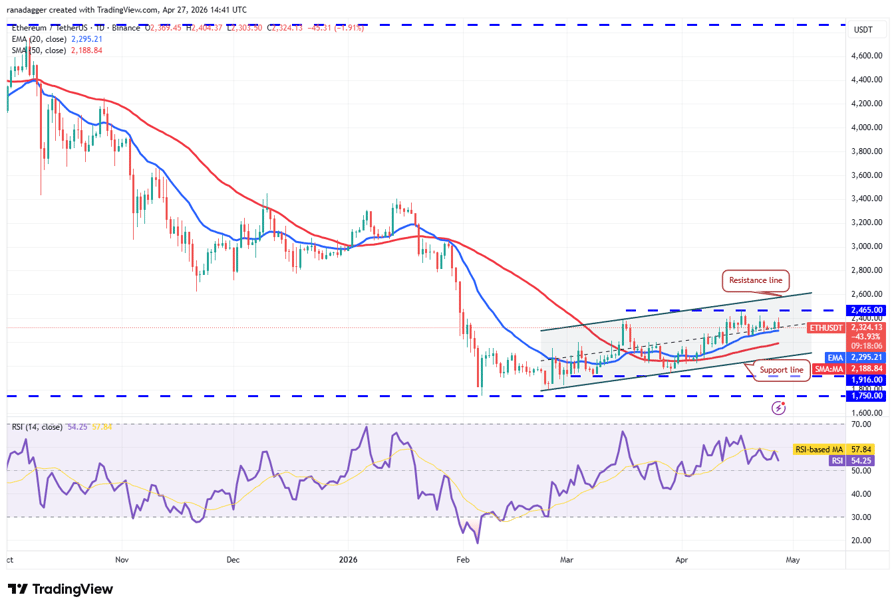
ETH/USDT daily chart. Source: Cointelegraph/TradingView
Sellers will attempt to strengthen their position by pulling the ETH price below the 20-day EMA. If they succeed, it suggests the ETH/USDT pair may remain within the ascending channel for a while longer.
Buyers will have to thrust the price above the resistance line to seize control. The pair may then soar to $3,050. Sellers will be back in the driver’s seat on a close below the support line.
XRP price prediction
XRP (XRP) remains stuck inside the $1.27 to $1.61 range, indicating buying on dips and selling on rallies.
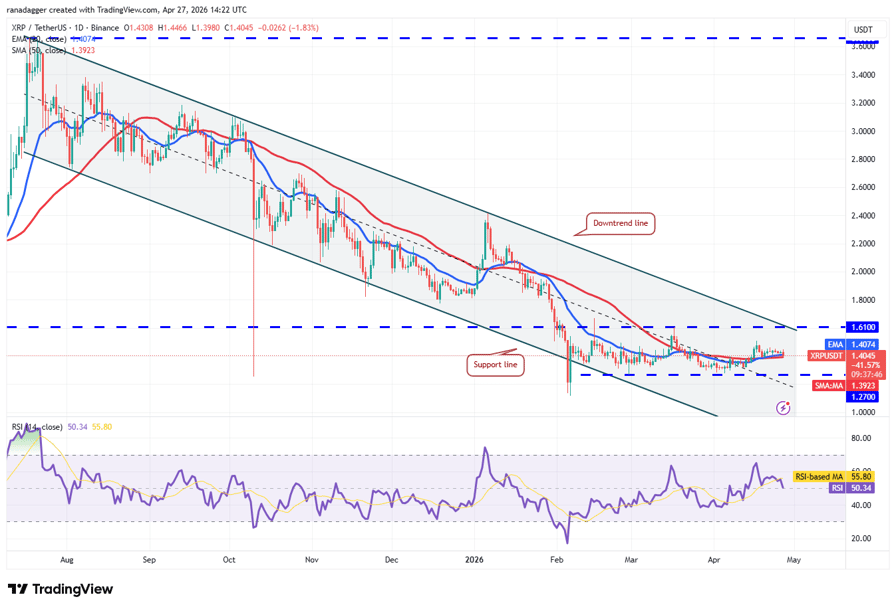
XRP/USDT daily chart. Source: Cointelegraph/TradingView
The 20-day EMA ($1.40) has started to turn up gradually, and the RSI is near the midpoint, indicating that the bulls have a slight edge. There is minor resistance at $1.51, but if it is crossed, the XRP/USDT pair may reach the downtrend line. A break and close above the downtrend line signals a potential trend change. The pair may then rally to $2.
Sellers are likely to have other plans. They will attempt to pull the XRP price back below the moving averages, retaining the pair inside the range.
BNB price prediction
BNB (BNB) is finding support at the moving averages, but the bulls have failed to trigger a strong bounce off them.
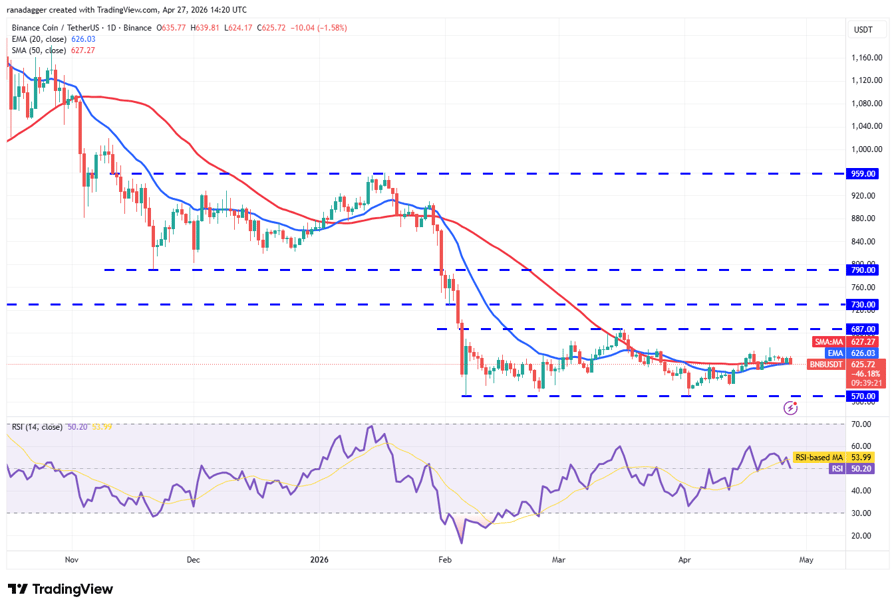
BNB/USDT daily chart. Source: Cointelegraph/TradingView
Buyers will need to drive the BNB price above $654 to signal strength. The BNB/USDT pair may then test the $687 resistance level, a critical level to watch. If buyers pierce the $687 level, the pair may jump to $730 and then to $790.
Instead, if the price turns down from the current level or the overhead resistance and breaks below the moving averages, it suggests the pair may remain within the $570 to $687 range for a few more days.
Solana price prediction
Solana (SOL) continues to trade near the moving averages, indicating a balance between supply and demand.
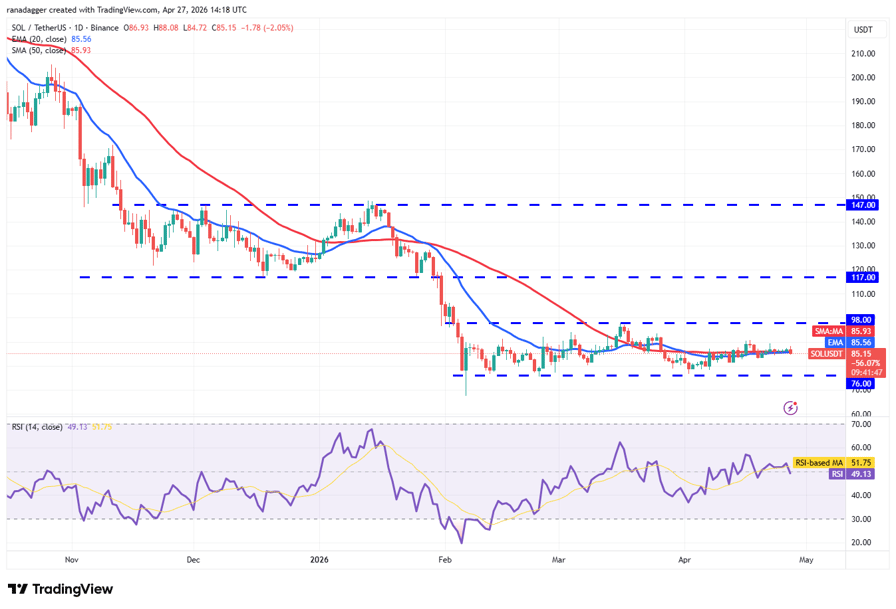
SOL/USDT daily chart. Source: Cointelegraph/TradingView
There is a minor obstacle at $90.73, but if that level is broken, the SOL/USDT pair may reach the $98 resistance. Sellers are expected to defend the $98 level with all their might, as a close above it opens the doors for a rally to $117.
Alternatively, if the SOL price turns down from the current level or the overhead resistance and breaks below $82.94, it suggests that the bears are attempting to take charge. The pair may then collapse to the $76 support.
Related: First 21-week trend line reclaim since October 2025: Five things to know in Bitcoin this week
Dogecoin price prediction
Dogecoin (DOGE) has been gradually moving higher but is expected to face selling in the $0.10 to $0.11 zone.
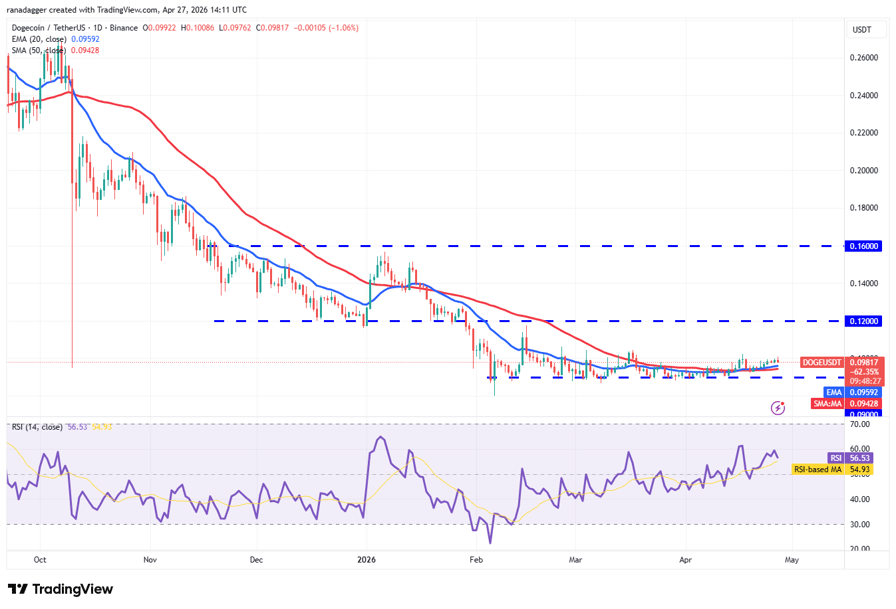
DOGE/USDT daily chart. Source: Cointelegraph/TradingView
If the DOGE price turns down from the overhead resistance zone, it is expected to find support at the moving averages. A sharp bounce off the moving averages increases the possibility of a rally to the $0.12 level.
Contrarily, if the price turns down and breaks below the moving averages, it signals that the bears remain sellers on rallies. The DOGE/USDT pair risks resuming the downtrend if the $0.09 support breaks down.
Hyperliquid price prediction
Hyperliquid (HYPE) resumed its northward march after breaking above the $41.88 resistance on Sunday.
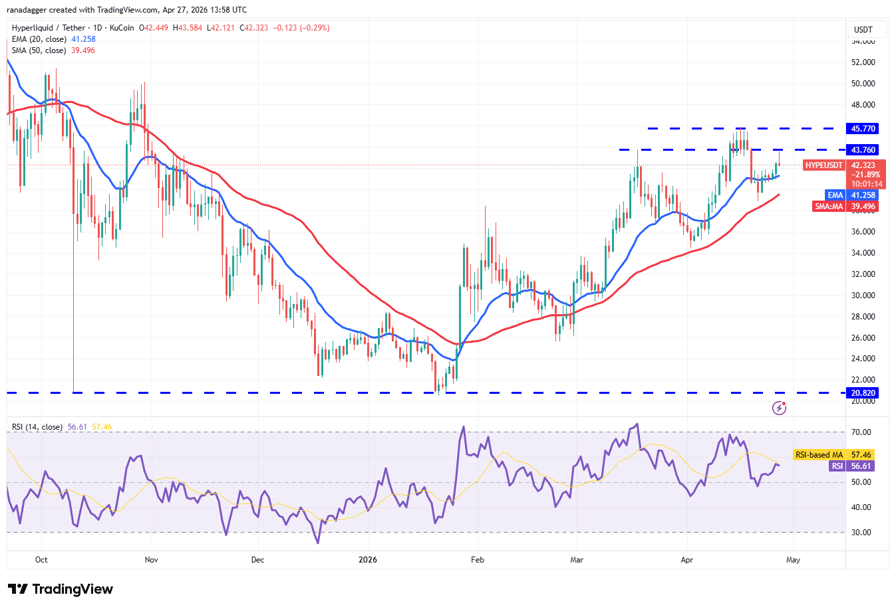
HYPE/USDT daily chart. Source: Cointelegraph/TradingView
The uptrend is facing selling pressure in the $43.76 to $45.77 zone, as seen in the long wick on the candlestick. Sellers will attempt to sink the HYPE price below the 20-day EMA ($41.25), opening the door to a drop toward the 50-day SMA ($39.50).
Conversely, if the price rises above the current level or the 20-day EMA and breaks above $45.77, it signals that the bulls remain in control. That may propel the HYPE/USDT pair toward the $50-$51.43 resistance zone.
Cardano price prediction
Cardano (ADA) has been clinging to the moving averages for several days, improving the prospects of an upside breakout.
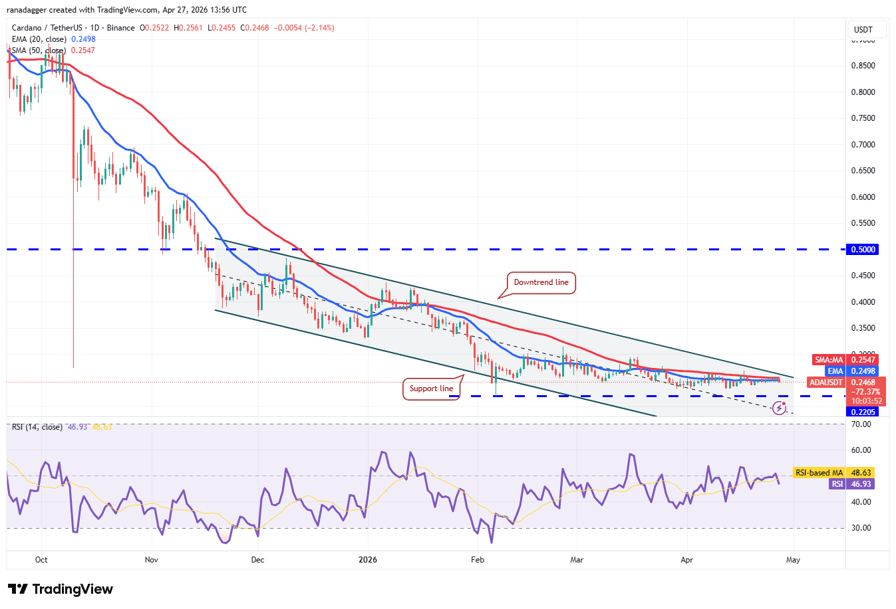
ADA/USDT daily chart. Source: Cointelegraph/TradingView
The downtrend line is the crucial resistance to watch out for as a close above it signals a potential short-term trend change. The ADA/USDT pair may surge to $0.32, then to $0.37.
On the contrary, if the ADA price turns down sharply from the downtrend line, it suggests that the bears are aggressively defending the level. The pair may then slump to the $0.22 support.