

The results from 2025 are intriguing. Screens are part of everyday life that many of us use for work, communication and entertainment. However, there are also signs that people are limiting their screen time. The total hours we are spending on screens has not really changed, but digging deeper, there is some change.
We are spending more time on our screens through our mobile devices, for example. Some countries are showing extreme levels of screen time, whereas others are very low. We can also see that people are completely switching off their screens, digital detoxing or leaving social media.
Overall though, there is a balance. Across all age groups, screen time is something people are able to live with. This is maybe due to the spread of technology. But perhaps it is also down to us, and how humans are reacting to technology. In this report we explore how our screen habits are changing, and what this might mean for the future when AI spreads throughout our lives.
Global Average Screen Time per Day (2018–2025)
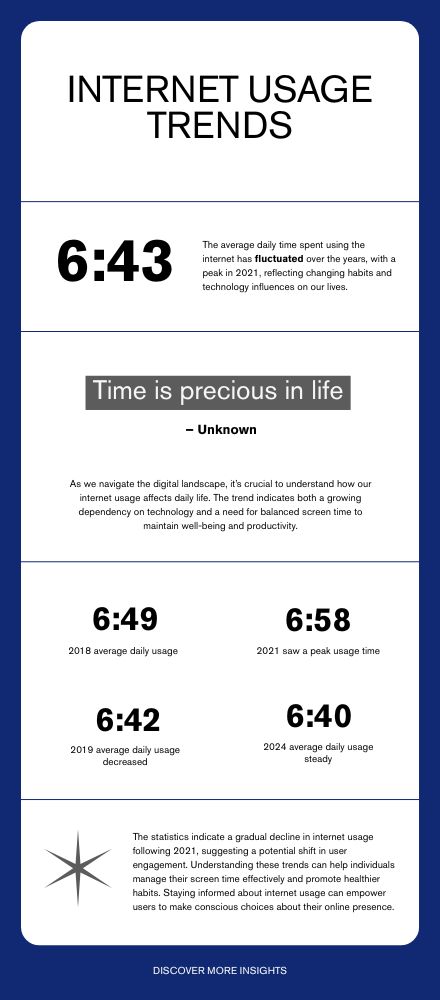

Looking at the big picture, eight years of screen time data, internet users have consistently spent just over 7 hours per day online.
GWI’s data show a modest bump during the COVID-19 era, a readjustment to a ‘new normal’, and a slight resurgence in recent years as AI-enabled tools make online activities quicker and more convenient.
For context, the data below show the average time spent per day using the internet across all devices among internet users aged 16-64, as measured by GWI and reported in DataReportal’s flagship reports.
The big story
- A pre-COVID equilibrium of ~6 hours 45 minutes per day (2018-2020),
- A COVID-driven peak of ~7 hours per day (2021-early 2022),
- A drop back in 2023, a slight increase in 2024, and a near-flattening of the curve in 2025.
Average daily time spent using the internet (hrs:mins)
YearHrs:Min20186:4920196:4220206:4320216:5820226:5320236:3720246:4020256:38
Source: GWI, via DataReportal Notes: times are rounded to the nearest minute, and these figures are based on single data points in each year (or the closest available point in each year’s Digital, Social & Mobile or Statshot series), so some quarter-on-quarter variation is to be expected. This metric is based on self-reported data relating to internet use across all devices by internet users aged 16-64.
My analysis
The way I see this is that we’re witnessing the stabilisation of the digital day. The COVID bump wasn’t a permanent step-change; internet users shaved off an average of 20 minutes by 2023 as they returned to offices, classrooms, and commutes.
However, that baseline is now notably higher than it was pre-COVID, at around 6½ hours per day. There are two important considerations for AI developers in this context:
In summary: it looks like daily screen time is limited by human behavioural constraints, but how that screen time is allocated is still up for grabs, and AI is already changing the flow.
Screen Time by Device Type (2025)
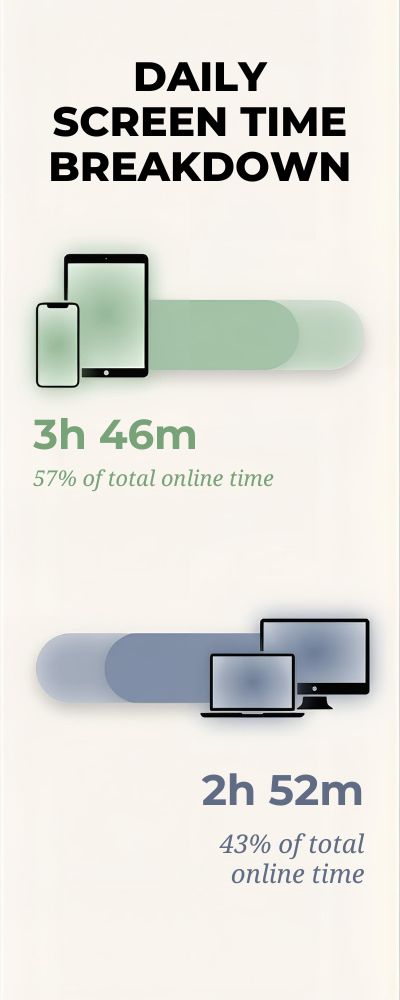
To get a more detailed view of the amount of time we spend in front of the screen every day in 2025, let’s look at how this time is divided between devices. As you can see below, DataReportal’s Digital 2025 report reveals that the global average user currently spends 3 hours 46 minutes per day connected to the Internet through their mobile devices (including mobile phones and tablets) and 2 hours 52 minutes per day through computers (including laptops and desktops).
- Mobile: 57 % of the daily time spent online
- Computers: 43 % of the daily time spent online
Source: DataReportal’s Digital 2025 report
Here are my two cents on this:
Device TypeDaily Average TimeApproximate Share of Total Online TimeMobile (smartphones/tablets)3 h 46 min~57 %Computer (laptops/desktops)2 h 52 min~43 %
This device-based distribution highlights two key points to me: On the one hand, it’s no secret that we’re spending more and more time on our mobiles, but the fact that we’re still devoting almost half of our digital time to computers shows that there are use cases for which we still prefer or need larger screens.
What does this mean exactly? Well, basically, we tend to favour our mobile for micro-moments, for example when we need fast information or micro-entertainments, whereas we prefer computers for more productive or immersive activities that require our undivided attention or more screen real estate.
Now, if you’re building a new product or service for your customers and you’re wondering how you could leverage the possibilities of AI, I think the proportion of mobile time is an invitation to imagine new always-on experiences, new on-the-go services or contextual tools… But, the proportion of computer time is a reminder not to overlook the so-called “lean back” experiences, i.e. moments when the user is likely to spend more time on their device, as they engage in more complex activities such as creating content or accomplishing tasks.
In a nutshell: yes, you should definitely design AI-based experiences to accompany users in their moment, anytime, anywhere, but you should not forget to propose experiences adapted to “computer time” use cases, when the user has more time to spend and more things to do… As always, understanding how your target audience distribute their time between devices will enable you to design better experiences for them, to adjust your service offering to their needs, use cases and moments.
Screen Time by Region and Country (2025)
Now let’s look at the global screen time distribution, by region, in 2025:
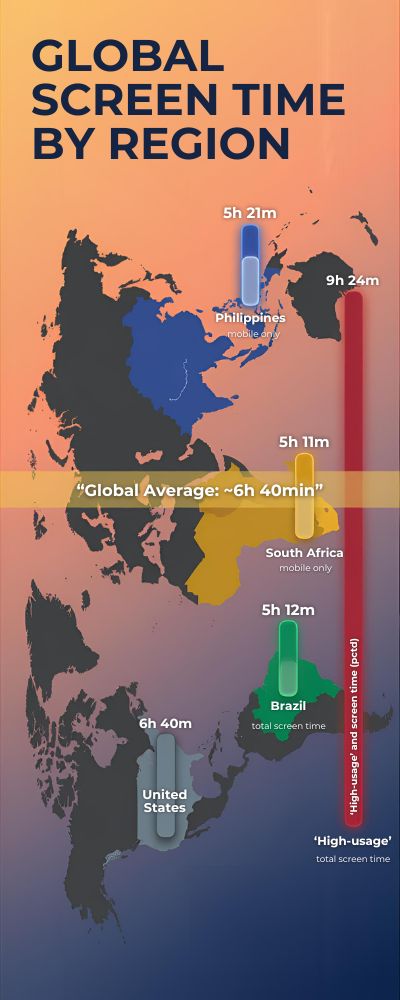
Source: Global average screen time, 2025: 6 hours 40 minutes per person. Top countries by screen time: over 8, and even over 9, hours per day.
Here are some key screen time stats, by region, and interesting examples of countries:
Here are some observations and comments:
Region or CountryDaily Average Screen TimeGlobal Average~6 h 40 minPhilippines (Asia)~5 h 21 min (mobile only)Brazil (South America)~5 h 12 min (mobile only)South Africa (Africa)~5 h 11 min (mobile only)United States (North America)~6 h 40 min“High-usage” (e.g., some African / South American) countriesUp to ~9 h 24 min (total screen time)
Mobile screen time in the Philippines averages 5 h 21 min per day. Brazil and South Africa have the next highest mobile screen time, at over 5 hours per day. Some sources suggest extreme screen time in some countries, up to 9 h 24 min. North America (e.g., the United States) has relatively average total screen time (6 h 40 min).
My analysis
It seems to me that the variance in screen time across different regions is a function of both structural and behavioural factors.
On the structural side:
Countries with high mobile penetration have lower desktop usage and higher mobile screen time. Countries where data costs are relatively low, or where streaming and entertainment options are increasing rapidly, will have higher screen time.
On the behavioural side:
Cultural factors play a role. Countries where communication and entertainment are increasingly focused on social media, messaging and video will have higher screen times. More developed markets may have lower screen times, because the value of each additional hour of screen time is lower, not to mention the influence of regulations, health and wellness and availability of offline alternatives.
For AI (in the context of this broader piece on AI stats) the implications are that:
When you are thinking about regional strategies for AI-enabled experiences, you need to understand that one size will not fit all. In high-screen-time markets (5+ hours on mobile), there may be potential for continuous, micro-interactions, where AI can hum along in the background of many, short interactions with the device.
In moderate-screen-time markets (closer to the global average) you may want to focus on providing value-added interactions, asking whether AI can help people get more value from their more limited screen time.
Additionally, in markets with high screen time and high mobile dominance, AI experiences that assume an “always-on” and “always‐connected” state may be successful, whereas in lower screen time markets you may need to design for assumptions around connectivity, device, cost and attention span.
I think that the relatively moderate global average (6 h 40 min) hides a long tail, where there is considerable variation. If you are an organisation with global ambitions to deploy AI-enabled experiences, understanding and designing for those tails may represent a source of competitive advantage.
Demographic Breakdown of Screen Usage (Age & Gender)
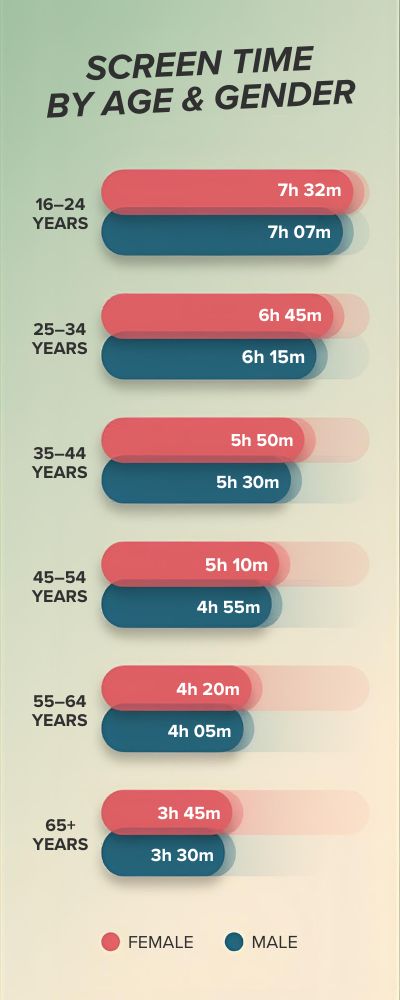
Interestingly, when it comes to digital screen time, age and sex are not created equal. Recent data shows that not only do younger age groups consume more screen time than their older counterparts, but there are also some interesting differences between the sexes in each age category.
At a global level, digital screen time among internet users aged 16-64 stood at 7 hours 32 minutes per day among young females, versus 7 hours 07 minutes among their male counterparts.
Among internet users aged 55-64, screen time stood at an average of 5 hours 17 minutes per day among women, compared to 5 hours 14 minutes among men.
Here is a breakdown of the figures:
Age GroupFemale Avg. Screen TimeMale Avg. Screen Time16-24 years~7 h 32 min~7 h 07 min25-34 years~7 h 03 min~7 h 13 min35-44 years~6 h 25 min~6 h 40 min45-54 years~6 h 09 min~6 h 05 min55-64 years~5 h 17 min~5 h 14 min
Analyst’s Comment
This data says a few interesting things to me from a personal level:
Returning to the wider theme of this article looking at AI statistics, when it comes to the development of AI-enabled tools, interfaces, or services, you shouldn’t assume that “screen time” is a fixed variable.
This will influence the nature of the design language being used, how attention is allocated, the level of user tolerance to friction, and a whole lot more.
Moreover, these factors will vary by age and to a lesser extent sex. So if your AI-enabled solution is targeting a younger demographic, you may have greater scope to assume that your users will have the time and patience to see it through. Incorporating scopes to iterate, gamify, or otherwise encourage exploration may be important for maximizing engagement.
In contrast, if you are targeting an older demographic, the emphasis should be placed on simplicity and speed of use, with a reduced emphasis on ‘fun’ and greater weight on education, transparency, and trust.
Overall, the age (and to a lesser extent sex) of users plays an influence on levels of screen time, and in turn this will influence the propensity and ability of users to engage with AI-powered online experiences.
Social Media Usage Reduction Statistics (2025)
Some initial evidence in 2025 of social media consumption, globally, peaking or even reducing, slightly, from previous years. There are reports of declines in time spent, organic reach and engagement. Whilst of interest to all of us who follow human digital activity in the context of AI and automation, these changes are small.
The average amount of time spent on social media per person is now approximately 2 hours and 21 minutes per day in 2025, slightly less than 2024.
Organic reach on most platforms is falling: one report suggests that reach per post on Instagram has fallen by 12% year on year to around 3. 50%. Engagement rates are falling too: one report suggests that the average engagement rate per post on Instagram in 2025 is now around 0. 50%, a 28% fall from 2024. 2025 Social Media Usage & Engagement Metrics
MetricValueAverage daily time on social media~2 h 21 minOrganic reach rate – Instagram~3.50% (–12% YoY)Post engagement rate – Instagram~0.50% (–28% YoY)
Analyst’s Takeaway
From my perspective, the story here is not so much that the wheels are falling off social media as much as it is a story about social media levelling off. The average social media user is easing off the throttle a bit, perhaps as a consequence of fatigue, a desire to improve digital well-being or perhaps because there is a limit to how much time you can spend on social media.
Falling reach and engagement rates suggest that social media platforms are getting increasingly crowded, and brands may have to try harder to cut through. What does this mean for AI strategies and other digital strategies? Well, there are two key implications here:
In a nutshell: social media is no longer a greenfield for increasing time-spent; it is moving into a period of congestion and optimisation. If you are investing in AI experiences that are linked to social media platforms, a much better strategy is to focus on quality of experience and intentful experiences rather than relying on time-spent to lift you up.
Digital Detox Adoption Rates (2023–2025)
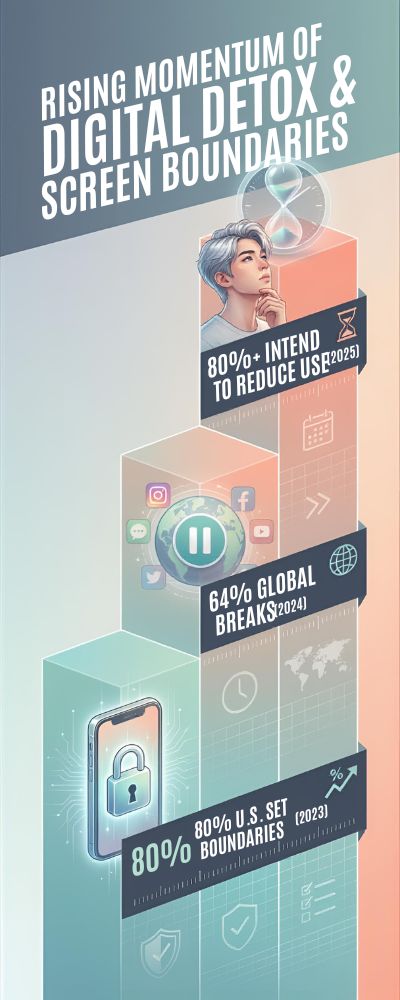
Digital detoxing has been on the rise from 2023-2025. To clarify, this is the practice of abstaining from devices and screens, usually to avoid digital clutter. Like many statistics, there are a few studies that give us a partial view of the trend:
- 2024 Digital detox trends: 64% of people have taken a digital detox from social media (though 49% came back)
- May 2024 Digital detox survey of Germans: 55% of under 45s think they use their smartphone more than last year, 84% of 18-24s believe they use their smartphone too much
- 2023 US Digital Detox: Based on screen-boundary setting: 80% of smartphone users have at least one self-imposed screen time rule or boundary
Table: Adoption of Digital-Detox / Screen-Boundary Activities
YearApproximate Adoption / Boundary Behaviour RateNotes2023~ 80% (users with at least one screen-time boundary)U.S. smartphone users setting at least one limit.2024~ 64% (people taking some break from social media/screens)Global figure cited in broader digital-wellbeing stats.2025~ (>80% saying they “feel they use too much” and intend to reduce)E.g., in German survey: 84 % of 18-24s believe overuse; suggests readiness to detox.
My Thoughts
Going forward, I think it is safe to assume that digital detoxing is a thing of the mainstream. Not in the way that half the population is abandoning their devices, but that a large proportion of the population are setting boundaries on their screen time, rather than looking for a complete digital detox.
My thoughts on what this means for business and AI-powered digital products: Now assume that users will (and do) put boundaries on the experience. Unless your AI service is for a critical “must-do” flow, assume that users will have rules in place.
This is shown by the ~80% of smartphone users that have at least one screen time rule. This means that if you build an AI experience that assumes that your users are always connected, will give you unlimited attention, it may meet some resistance. Now is the time to assume that users will, and do put boundaries on their usage.
There’s an opportunity in structured disengagement. Users who set boundaries will always return to their devices at some point, so there is an opportunity to create a “welcome back” experience.
Perhaps there is also an opportunity to create micro-experiences that can be completed in a short amount of time, rather than requiring hours of attention.
Different demographics, different countries will have varying levels of digital detoxing. In the German survey, 84% of 18-24s believed they used their smartphones too much.
This tells me that younger users who are intensive users are more likely to want to digitally detox. This means that digital wellbeing features (like “do not disturb” “focus mode” or “downtime” modes) are more likely to be used by this demographic. Other demographics may lag in terms of adoption, but awareness will grow over time.
Conclusion
The steady growth in digital-detox behaviors indicates that the way that we interact with digital products is changing. For anyone who is building an AI-powered experience, it is important to respect that your users are putting in boundaries (i.e., they want to limit their usage).
It is also important to embrace the shorter periods of high-intent interaction rather than designing experiences that assume your users are always connected. This trend doesn’t reduce the overall size of your addressable market, but it does mean that you may need to change when and how you interact with your users.
Average Duration of Digital Detox Periods (2025)
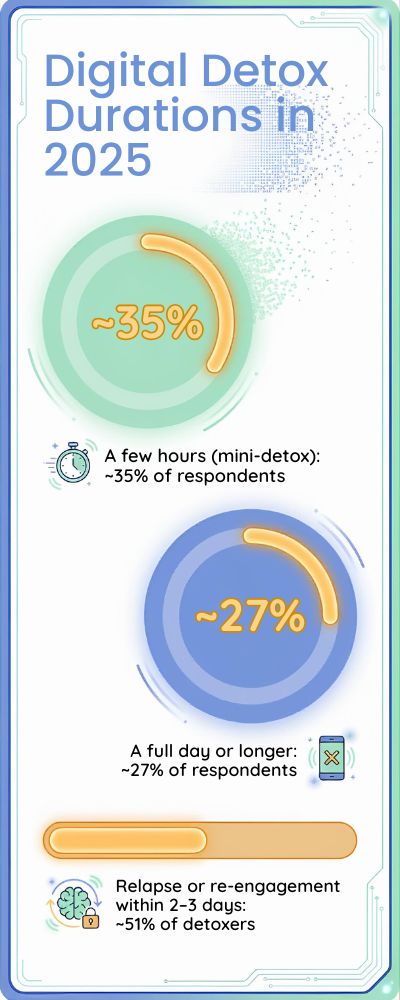
A “hot” topic among those who are removing themselves from the screen is for how long? There isn’t a lot of global data available, but one or two recent studies provide some insights for 2025:
- 35% of people claim to take “short-break” digital detoxes, lasting a few hours
- 27% have engaged in longer-duration detoxes (e.g., a full day or more) in recent months.
The table below shows the available data:
Duration of DowntimeShare of RespondentsNotesA few hours (mini-detox)~ 35 %Breaks taken during day to step away from screensA full day or longer~ 27 %More sustained unplugging events in recent monthsRelapse or re-engagement within 2–3 days~ 51 % of those who detoxed from social media
Analyst’s Comments
In my view, the data shows that digital-detox is predominantly of the short-form, a few hours, as opposed to longer-term, device-abstinence. The fact that 35% of people claim to only take a few hours out, suggests to me that digital-detox is about re-setting rather than abstinence. 27% is a big chunk for a digital detox of a day or more, but it’s still a minority.
If you’re building AI solutions, what does this mean? Services need to respect the brevity of digital-detox. With 35% of people only taking a few hours out, solutions should consider micro-sessions following a digital detox, rather than expecting people to come back for a full session. The “come back” moment may only be short.
Solutions should assume re-lapse. Given ~51% of social media digital detoxers returned within 3 days, solutions shouldn’t assume a complete re-set. AI powered solutions that help people “come-back” through reminders, gentle reminders or even content curation, could be important.
Services need to cater for mixed-duration digital-detox. Solutions that can cope with the mix of a few hours vs. full day digital-detox (and potentially other variations) will be important. Perhaps solutions will need different states for “quick-offline” and “full-offline”. Different levels of connectedness, push notifications and content caching.
In Summary:
Digital-detox in 2025 is real, but mostly modest in terms of duration. The trend is an important one, with people actively choosing to take time out, but duration needs to be considered when building AI solutions for “come-back”, attention and session duration.
Putting all of the data together paints a picture of a world where screen time has flattened out, where there are still regional disparities, where gender and age still play a role in screen time and where digital-detox is increasingly common.
But most importantly, screen time data in 2025 shows that where people are making active choices. Average screen time may have flattened out, but the time people spend in digital-detox, is a more important signal.
Whether it’s just a few hours or a full day, the fact people are actively choosing digital detox, reflects a desire for efficiency, for well-being and for time. And for those of us involved in AI or analytics, this should be an important signal.
Solutions that consume ever more time are not necessarily the way forward. Instead, we should be focused on enriching the time that is available. The way technology, and specifically AI fits into more purposeful screen time regimes will be increasingly important in the future. In many ways, that’s the real story of screen time in 2025.
Sources and References